旋转Matplotlib颜色地图

3

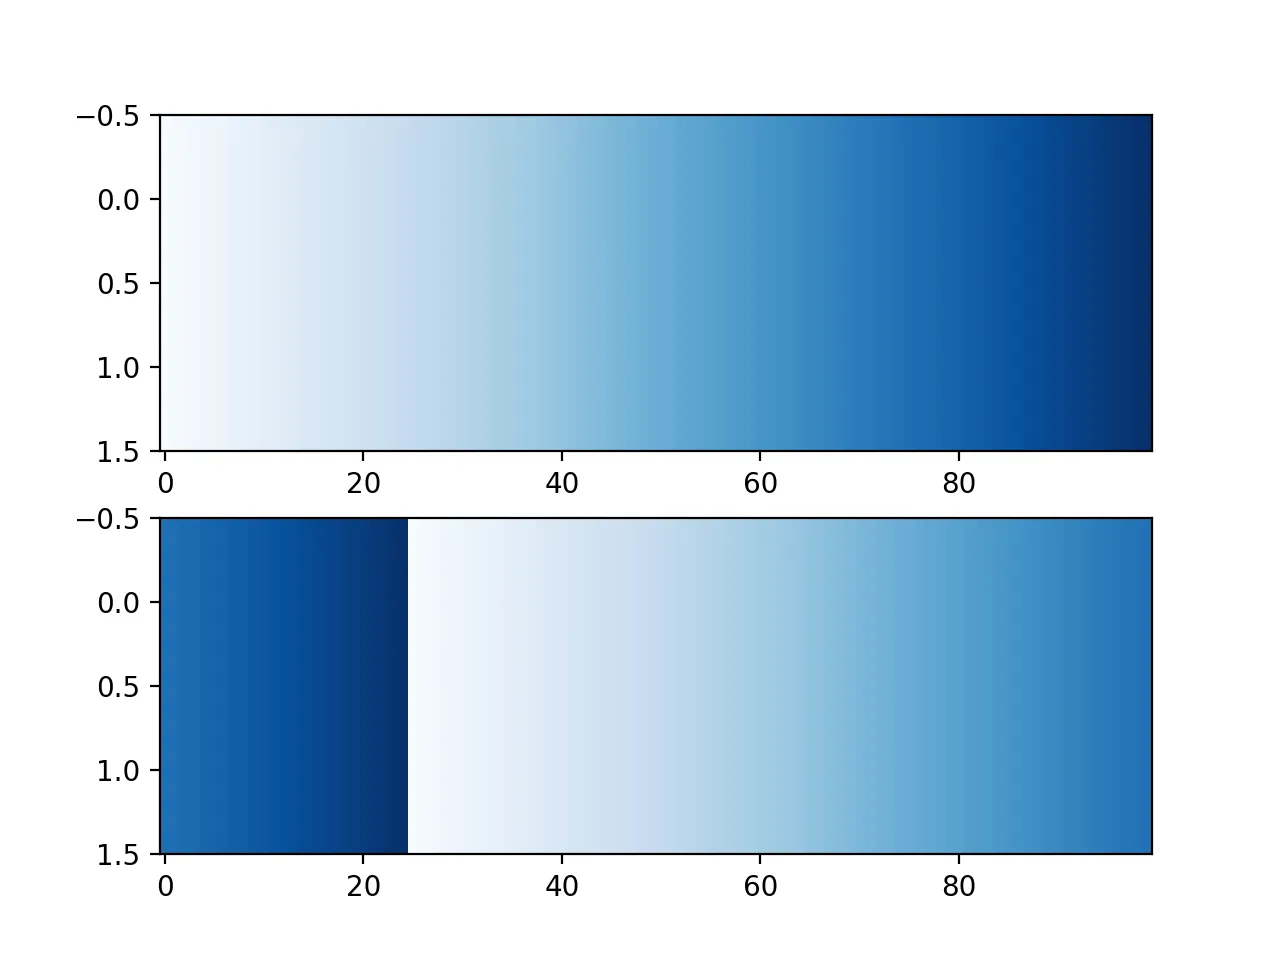
ProPlot Python软件包为Matplotlib库添加了额外的功能,其中包括颜色地图操作。对我来说特别有吸引力的一个功能是能够旋转/移位颜色地图。以下是一个示例:

import proplot as pplot
import matplotlib.pyplot as plt
import numpy as np

state = np.random.RandomState(51423)
data = state.rand(30, 30).cumsum(axis=1)

fig, axes = plt.subplots(ncols=3, figsize=(9, 4))
fig.patch.set_facecolor("white")

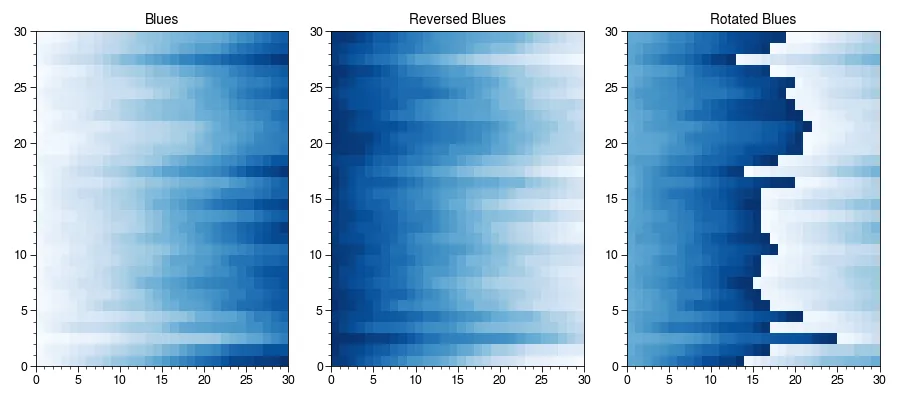
axes[0].pcolormesh(data, cmap="Blues")
axes[0].set_title("Blues")
axes[1].pcolormesh(data, cmap="Blues_r")
axes[1].set_title("Reversed Blues")
axes[2].pcolormesh(data, cmap="Blues_s")
axes[2].set_title("Rotated Blues")

plt.tight_layout()
plt.show()

enter image description here

在第三列,您可以看到Blues的180°旋转版本。目前ProPlot存在一个错误,不允许用户将绘图样式恢复为Matplotlib的默认样式,因此我想知道是否有一种简单的方法在Matplotlib中旋转颜色地图而不必借助ProPlot。我总是觉得Matplotlib中的cmap操作有点神秘,所以任何帮助都将不胜感激。

你可以在proplot中为每个图形添加适当的颜色条,但这是否解决了问题呢?请参见此链接(8) - r-beginners
@r-beginners 我的问题不是关于颜色条的。我的问题是ProPlot有一个bug,所以我想知道是否可以用普通的Matplotlib实现相同的效果。 - MPA
2个回答

4
如果您试图进行的操作是转换颜色映射,那么这可以(相对)容易地实现:
def shift_cmap(cmap, frac):
    """Shifts a colormap by a certain fraction.

    Keyword arguments:
    cmap -- the colormap to be shifted. Can be a colormap name or a Colormap object
    frac -- the fraction of the colorbar by which to shift (must be between 0 and 1)
    """
    N=256
    if isinstance(cmap, str):
        cmap = plt.get_cmap(cmap)
    n = cmap.name
    x = np.linspace(0,1,N)
    out = np.roll(x, int(N*frac))
    new_cmap = matplotlib.colors.LinearSegmentedColormap.from_list(f'{n}_s', cmap(out))
    return new_cmap

演示:

x = np.linspace(0,1,100)
x = np.vstack([x,x])

cmap1 = plt.get_cmap('Blues')
cmap2 = shift_cmap(cmap1, 0.25)

fig, (ax1, ax2) = plt.subplots(2,1)
ax1.imshow(x, aspect='auto', cmap=cmap1)
ax2.imshow(x, aspect='auto', cmap=cmap2)

enter image description here


1
为了颠倒一个 ListedColormap,有一个内置的 reversed() 方法,但是为了达到预期的旋转效果,我们必须自己创建一个函数。
#fake data generation 
import numpy as np
np.random.seed(123)
#numpy array containing x, y, and color
arr = np.random.random(30).reshape(3, 10)


from matplotlib import pyplot as plt
from matplotlib.colors import ListedColormap

def rotate_cm(co_map, deg=180): 
    #define a function where the colormap is rotated by a certain degree 
    #180° shifts by 50%, 360° no change
    n = co_map.N
    #if rotating in the opposite direction feels more intuitive, reverse the sign here
    deg = -deg%360
    if deg < 0:
        deg += 360
    cutpoint = n * deg // 360
    new_col_arr = [co_map(i) for i in range(cutpoint, n)] + [co_map(i) for i in range(cutpoint)]
    return ListedColormap(new_col_arr)
     

fig, (ax1, ax2, ax3) = plt.subplots(1, 3, figsize=(21,7))
#any listed colormap
my_cm = plt.cm.get_cmap("inferno")

#normal color map
cb1 = ax1.scatter(*arr[:2,:], c=arr[2,:], cmap=my_cm, marker="o")
plt.colorbar(cb1, ax=ax1)
ax1.set_title("regular colormap")

#reversed colormap
cb2 = ax2.scatter(*arr[:2,:], c=arr[2,:], cmap=my_cm.reversed(), marker="o")
plt.colorbar(cb2, ax=ax2)
ax2.set_title("reversed colormap")

#rotated colormap
cb3 = ax3.scatter(*arr[:2,:], c=arr[2,:], cmap=rotate_cm(my_cm, 90), marker="o")
#you can also combine the rotation with reversed()
#cb3 = ax3.scatter(*arr[:2,:], c=arr[2,:], cmap=rotate_cm(my_cm, 90).reversed(), marker="o")
plt.colorbar(cb3, ax=ax3)
ax3.set_title("colormap rotated by 90°")


plt.show()

样例输出: ![enter image description here


网页内容由stack overflow 提供, 点击上面的
可以查看英文原文,
原文链接