我对matplotlib不熟悉,想要重现像下面这样的图形,它是一个对数-对数图:
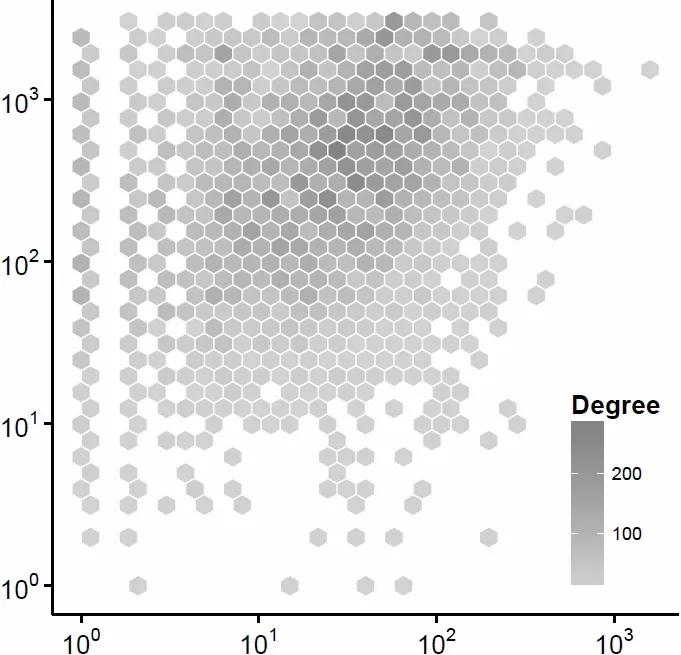
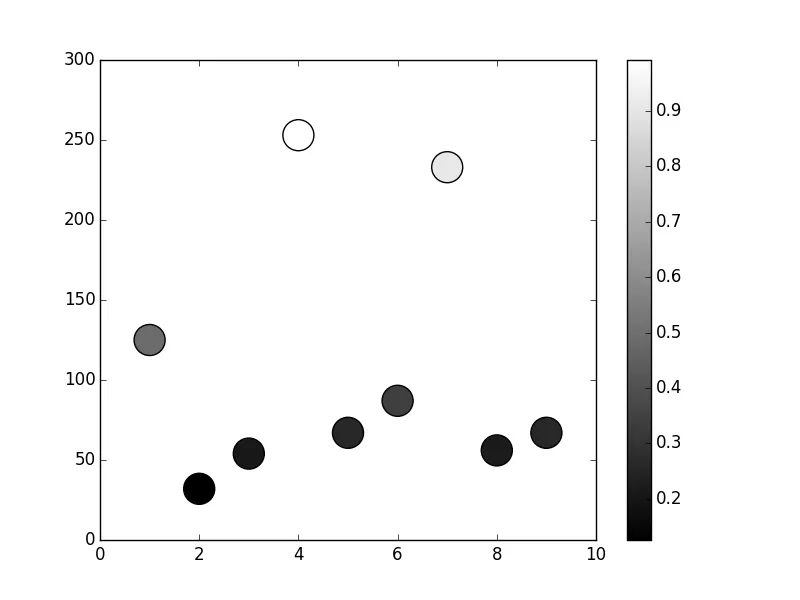
我知道我必须使用colormap根据我的x和y值创建这样的输出。但我想不出如何添加图例,以便能够动态计算颜色映射变量(例如这里称为“Degree”)的值。目前我已经为样本图形获得了以下结果:
from matplotlib import pyplot as plt

x = [1, 2, 3, 4, 5, 6, 7, 8, 9]
y = [125, 32, 54, 253, 67, 87, 233, 56, 67]

color = [str(item/255.) for item in y]

plt.scatter(x, y, s=500, c=color)

plt.show()
非常感谢您的帮助。
plt.colorbar()。 - Greg K.