我想知道Matplotlib图中文本注释的边界矩形坐标,以图形分数坐标表示。然而,当我尝试访问与注释相关联的补丁的“范围”时,无论文本标签的大小如何,我都会得到Bbox(x0 = -0.33,y0 = -0.33,x1 = 1.33,y1 = 1.33)。这些坐标似乎与IdentityTransform相关联,但不会转换为任何有意义的图形分数坐标。如何获取标签的坐标(理想情况下是左下角和右上角)以图形分数单位表示?
示例:
示例:
import numpy as np
import matplotlib.pyplot as plt
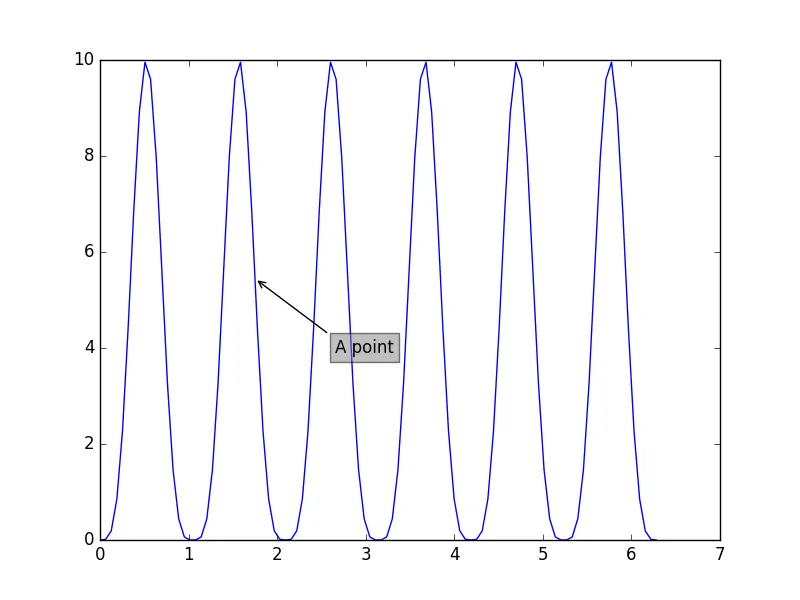
def f(x):
return 10 * np.sin(3*x)**4
x = np.linspace(0, 2*np.pi, 100)
y = f(x)
fig, ax = plt.subplots()
ax.plot(x,y)
xpt = 1.75
ypt = f(xpt)
xy = ax.transData.transform([xpt, ypt])
xy = fig.transFigure.inverted().transform(xy)
xytext = xy + [0.1, -0.1]
rdx, rdy = 0, 1
ann = ax.annotate('A point', xy=xy, xycoords='figure fraction',
xytext=xytext, textcoords='figure fraction',
arrowprops=dict(arrowstyle='->', connectionstyle="arc3",
relpos=(rdx, rdy)),
bbox=dict(fc='gray', edgecolor='k', alpha=0.5),
ha='left', va='top'
)
patch = ann.get_bbox_patch()
print(patch.get_extents())
给出:
[[-0.33 -0.33]
 [ 1.33  1.33]]

c = patch.get_transform().transform(patch.get_extents())
print(c)
提供:
[[-211.2 -158.4]
 [ 851.2  638.4]]
我猜这些是显示坐标,但它们与我想要属性的标签的位置和大小不对应。
plt.show()之后才能重现正确的 bbox 坐标:调用fig.canvas.draw()是不够的... 这是后端问题吗?我使用的是 OS X。 - xnxagg、TkAgg和Qt4Agg是有效的。 - ImportanceOfBeingErnest