我希望能够通过pandas DataFrame.plot()方法来移除matplotlib图形的y轴,使其不可见,并将x轴更改为虚线。最接近这个要求的是pyplot.box(False)语句,但它不能让我选择只有y轴,而且我仍然不知道如何按照描述编辑x轴。我该怎么做?
1个回答
3
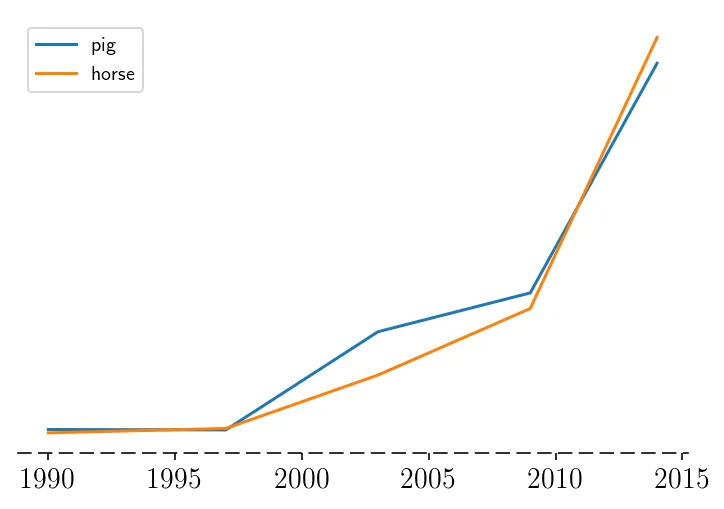
这里有一种方法可以实现。我选择了一个示例DataFrame来绘图。诀窍是隐藏左、右和顶部轴脊骨,并使用此处建议的方法将下方x轴变成虚线,由@ImportanceOfBeingEarnest提供。
import pandas as pd
import matplotlib.pyplot as plt

fig, ax = plt.subplots()

df = pd.DataFrame({'pig': [20, 18, 489, 675, 1776],
                   'horse': [4, 25, 281, 600, 1900]
                  }, index=[1990, 1997, 2003, 2009, 2014])
ax_ = df.plot.line(ax=ax)

for spine in ['right', 'top', 'left']:
    ax_.spines[spine].set_visible(False)

ax_.spines['bottom'].set_linestyle((0,(8,5)))
plt.yticks([])
plt.show()
- Sheldore
1
是的,这完全解决了我的问题,这个功能确实非常有用! - undefined
网页内容由stack overflow 提供, 点击上面的可以查看英文原文,
原文链接
原文链接