我有同样的问题。我认为需要开发一个框架,以拥有一个六边形网格对象,然后可以应用于许多不同的数据集(如果能在 N 维度上实现将非常棒)。这是可能的,令我惊讶的是,Scipy 或 Numpy 没有相关内容(此外,似乎除了
binify 之外没有其他类似的内容)。
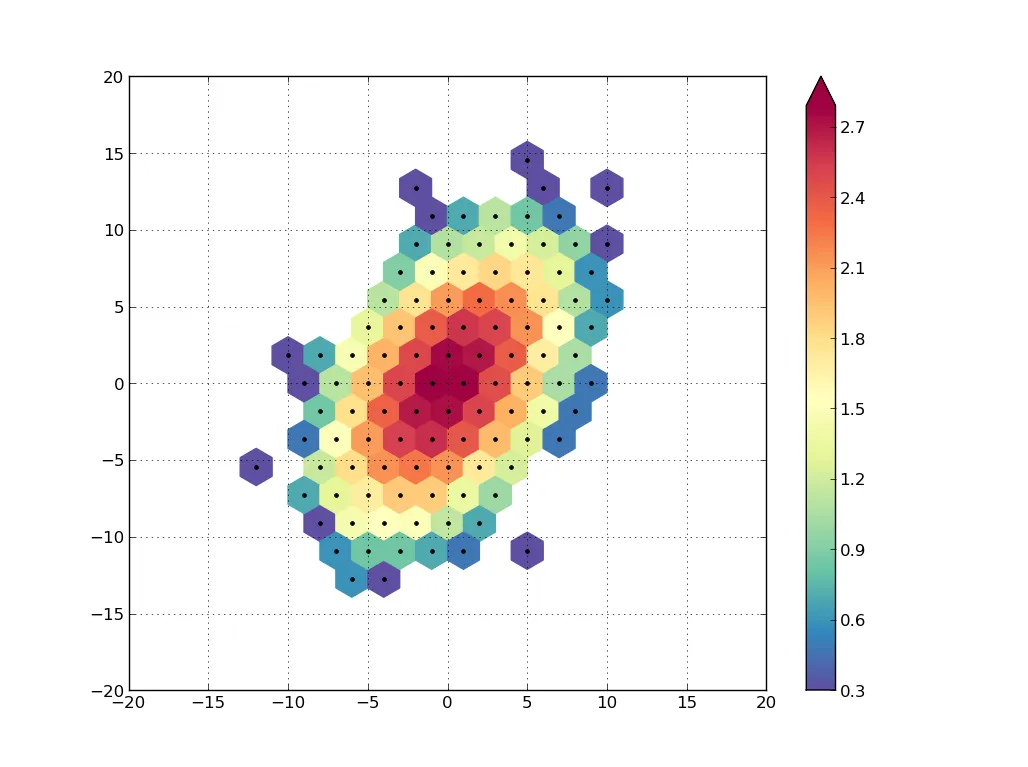
话虽如此,我假设您想使用六边形网格来比较多个分组数据集。这需要一些共同的基础。我使用 matplotlib 的 hexbin 来使其工作的方式如下:
import numpy as np
import matplotlib.pyplot as plt
def get_data (mean,cov,n=1e3):
"""
Quick fake data builder
"""
np.random.seed(101)
points = np.random.multivariate_normal(mean=mean,cov=cov,size=int(n))
x, y = points.T
return x,y
def get_centers (hexbin_output):
"""
about 40% faster than previous post only cause you're not calculating the
min/max every time
"""
paths = hexbin_output.get_paths()
v = paths[0].vertices[:-1]
vx,vy = v.T
idx = [3,0,5,2]
xmin,xmax,ymin,ymax = vx[idx[0]],vx[idx[1]],vy[idx[2]],vy[idx[3]]
half_width_x = abs(xmax-xmin)/2.0
half_width_y = abs(ymax-ymin)/2.0
centers = []
for i in xrange(len(paths)):
cx = paths[i].vertices[idx[0],0]+half_width_x
cy = paths[i].vertices[idx[2],1]+half_width_y
centers.append((cx,cy))
return np.asarray(centers)
class Hexagonal2DGrid (object):
"""
Used to fix the gridsize, extent, and bins
"""
def __init__ (self,gridsize,extent,bins=None):
self.gridsize = gridsize
self.extent = extent
self.bins = bins
def hexbin (x,y,hexgrid):
"""
To hexagonally bin the data in 2 dimensions
"""
fig = plt.figure()
ax = fig.add_subplot(111)
hexbin = plt.hexbin(x,y, mincnt=0,
gridsize=hexgrid.gridsize,
extent=hexgrid.extent,
bins=hexgrid.bins)
counts = hexbin.get_array().copy()
return counts, hexbin
if __name__ == "__main__":
hexgrid = Hexagonal2DGrid((21,5),[-70,70,-20,20])
x_data,y_data = get_data((0,0),[[-40,95],[90,10]])
x_model,y_model = get_data((0,10),[[100,30],[3,30]])
counts_data, hexbin_data = hexbin(x_data,y_data,hexgrid)
counts_model, hexbin_model = hexbin(x_model,y_model,hexgrid)
centers = get_centers(hexbin_data)
nonzero = counts_data != 0
variance_data = counts_data[nonzero]
square_diffs = (counts_data[nonzero]-counts_model[nonzero])**2
chi2 = np.sum(square_diffs/variance_data)
print(" chi2={}".format(chi2))