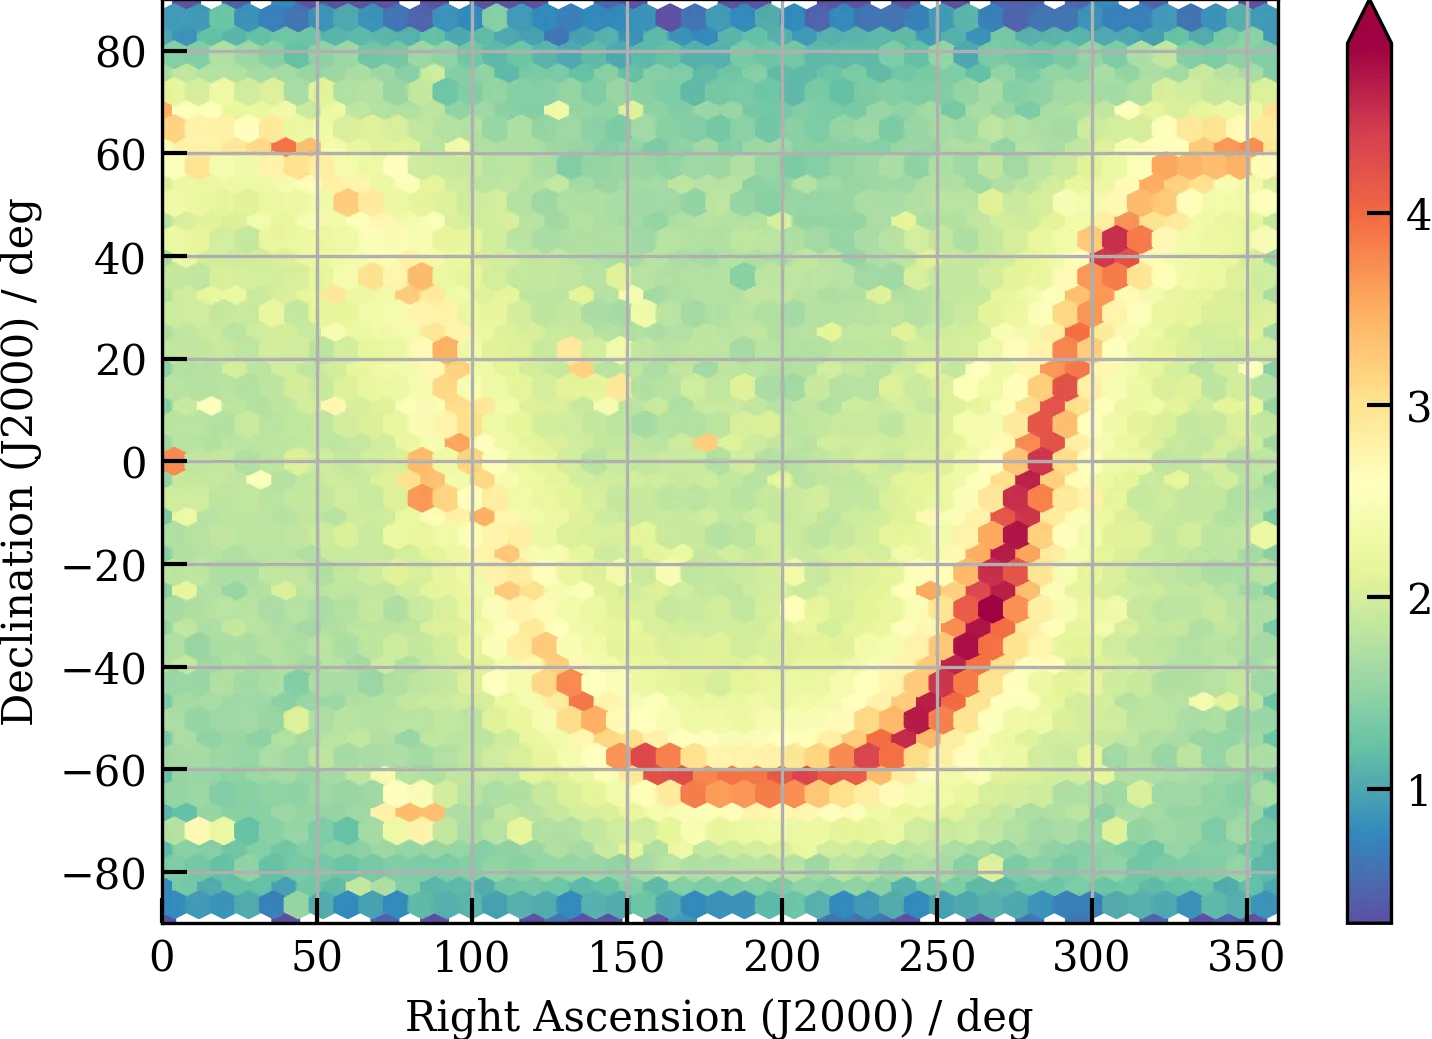
我有一个漂亮的六边形图,但我想知道是否有任何方法将六边形图投影到Aitoff上?关键代码如下:
import numpy as np
import math
import matplotlib.pyplot as plt
from astropy.io import ascii

filename = 'WISE_W4SNRge3_and_W4MPRO_lt_6.0_RADecl_nohdr.dat'
datafile= path+filename
data = ascii.read(datafile)
points = np.array([data['ra'], data['dec']])

color_map = plt.cm.Spectral_r
points = np.array([data['ra'], data['dec']])
xbnds = np.array([ 0.0,360.0])
ybnds = np.array([-90.0,90.0])
extent = [xbnds[0],xbnds[1],ybnds[0],ybnds[1]]

fig = plt.figure(figsize=(6, 4))
ax = fig.add_subplot(111)
x, y = points
gsize = 45
image = plt.hexbin(x,y,cmap=color_map,
    gridsize=gsize,extent=extent,mincnt=1,bins='log')

counts = image.get_array()
ncnts = np.count_nonzero(np.power(10,counts))
verts = image.get_offsets()

ax.set_xlim(xbnds)
ax.set_ylim(ybnds)
plt.xlabel('R.A.')
plt.ylabel(r'Decl.')
plt.grid(True)
cb = plt.colorbar(image, spacing='uniform', extend='max')
plt.show()
我已经尝试过:
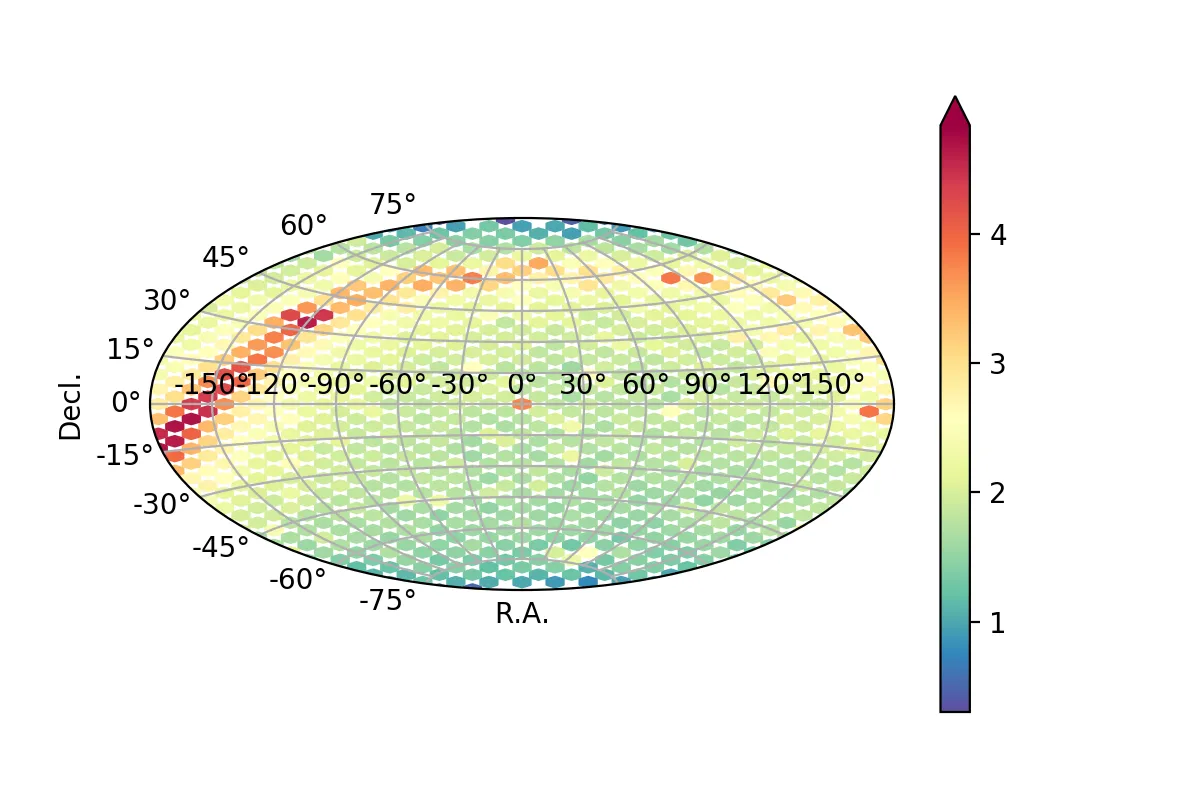
plt.subplot(111, projection="aitoff")
在执行
plt.hexbin命令之前,需要进行一些操作,但这只会生成一个漂亮但空白的Aitoff网格。
hexbin图形没有问题。如果没有提供最小完整可再现示例(mcve),没有人可以知道你的问题出在哪里。 - ImportanceOfBeingErnest