如何在两个Matplotlib hexbin图之间创建差异地图?

3
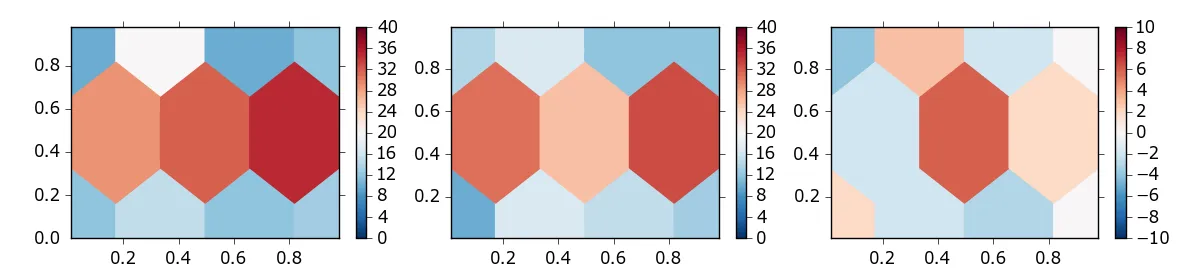
我在创建两个 matplotlib.pyplot hexbin 图之间的差异图时遇到了问题,这意味着首先要获取每个对应的 hexbin 的值差异,然后创建一个差异的 hexbin 图。为了给出我的问题的简单示例,假设 Map 1 中一个 hexbin 的值为 3,Map 2 中对应的 hexbin 的值为 2,我想做的是首先得到差异 3-2=1,然后在与 Map 1 和 Map 2 相同的位置上绘制它,即一个新的 hexbin 差异图。以下是我的输入代码和输出图。请问有人能给我解决这个问题的方法吗?感谢您的时间!
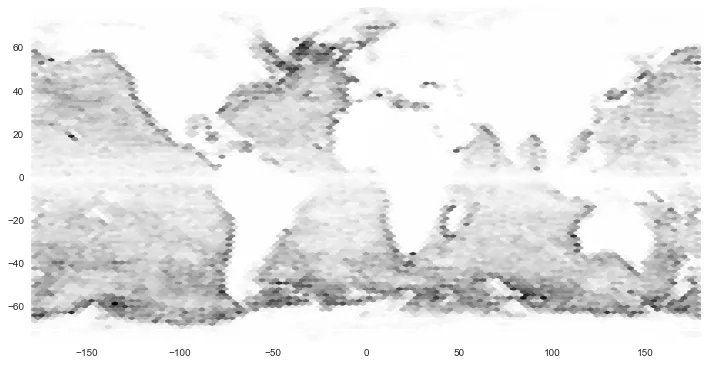
In [1]: plt.hexbin(lon_origin_df, lat_origin_df)
Out[1]: <matplotlib.collections.PolyCollection at 0x13ff40610>

enter image description here

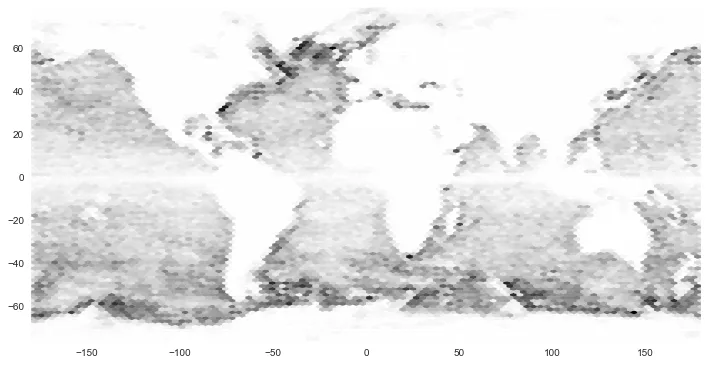
In [2]: plt.hexbin(lon_termination_df, lat_termination_df)
Out[2]: <matplotlib.collections.PolyCollection at 0x13fff49d0>

enter image description here


矩形直方图是否可行?hexbin的分箱逻辑与当前代码中创建多边形集合不可分。 - fjarri
下面的答案可行。还是谢谢大家! - geosciz
1个回答

4

使用h.get_values()可以获取h=hexbin()的值,使用h.set_values()可以设置其值,因此您可以创建一个新的hexbin并将其值设置为另外两个之间的差异。例如:

import numpy as np
import matplotlib.pylab as pl

x  = np.random.random(200)
y1 = np.random.random(200)
y2 = np.random.random(200)

pl.figure()
pl.subplot(131)
h1=pl.hexbin(x, y1, gridsize=3, vmin=0, vmax=40, cmap=pl.cm.RdBu_r)
pl.colorbar()

pl.subplot(132)
h2=pl.hexbin(x, y2, gridsize=3, vmin=0, vmax=40, cmap=pl.cm.RdBu_r)
pl.colorbar()

pl.subplot(133)
# Create dummy hexbin using whatever data..:
h3=pl.hexbin(x, y2, gridsize=3, vmin=-10, vmax=10, cmap=pl.cm.RdBu_r)
h3.set_array(h1.get_array()-h2.get_array())
pl.colorbar()

enter image description here


非常感谢!这确实帮了我很多! - geosciz

网页内容由stack overflow 提供, 点击上面的
可以查看英文原文,
原文链接