我想对齐两个图表的x轴,其中一个是imshow图表。
我尝试使用gridspec,如下所示:
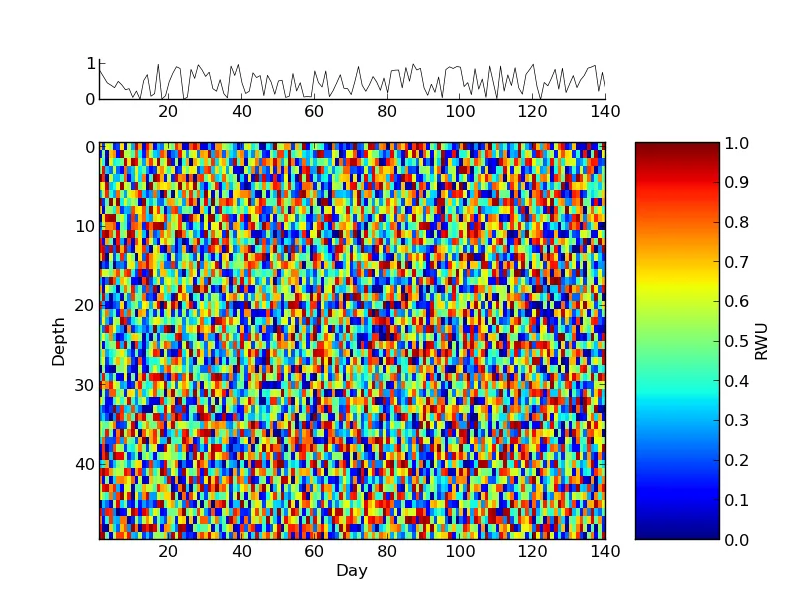
import matplotlib.pyplot as plt
import numpy as np
import matplotlib.gridspec as grd

v1 = np.random.rand(50,150)
v2 = np.random.rand(150)

fig = plt.figure()

gs = grd.GridSpec(2,1,height_ratios=[1,10],wspace=0)


ax = plt.subplot(gs[1])
p = ax.imshow(v1,interpolation='nearest')
cb = plt.colorbar(p,shrink=0.5)
plt.xlabel('Day')
plt.ylabel('Depth')
cb.set_label('RWU')
plt.xlim(1,140)

#Plot 2
ax2 = plt.subplot(gs[0])
ax2.spines['right'].set_visible(False)
ax2.spines['top'].set_visible(False)
ax2.xaxis.set_ticks_position('bottom')
ax2.yaxis.set_ticks_position('left')
x=np.arange(1,151,1)
ax2.plot(x,v2,'k',lw=0.5)
plt.xlim(1,140)
plt.ylim(0,1.1)
#
plt.savefig("ex.pdf", bbox_inches='tight')
我希望图形之间尽可能靠近,且一个图形的高度是另一个图形的1/10。如果我将颜色条去掉,它们似乎对齐了,但仍然无法使它们彼此靠近。我还希望保留颜色条。