我想画两个具有相同比例的场。上面的图像值比下面的高10倍,但它们在imshow中显示为相同的颜色。如何设置两者在颜色上具有相同的比例?
我在图像下面添加了我正在使用的代码...
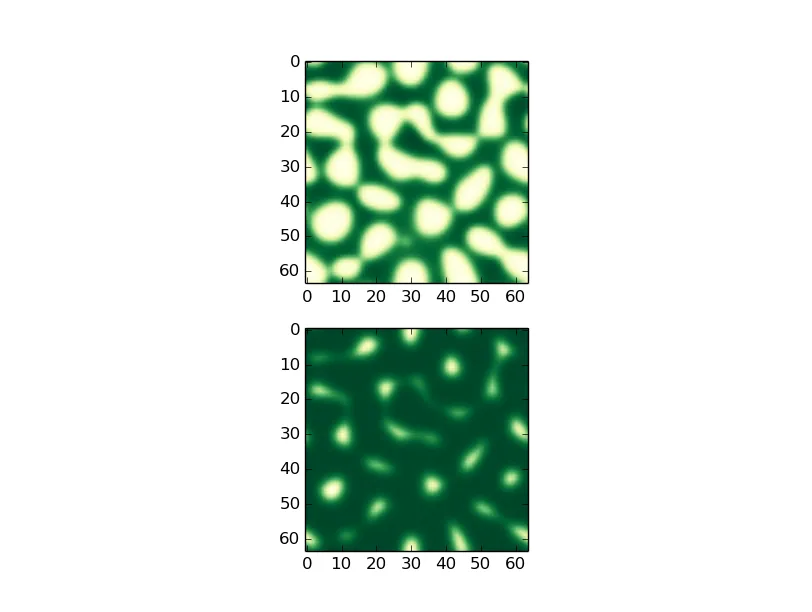
def show_field(field1,field2):
    fig = plt.figure()
    ax = fig.add_subplot(2, 1, 1)
    ax.imshow(field1,cmap=plt.cm.YlGn)
    ax.set_adjustable('box-forced')
    ax.autoscale(False)
    ax2 = fig.add_subplot(2, 1, 2)
    ax2.set_adjustable('box-forced')
    ax2.imshow(field2,cmap=plt.cm.YlGn)
    ax2.autoscale(False)
    plt.show()
vmin和vmax参数。 (另外提一句,这是一个重复的问题,但我目前找不到规范版本...) - Joe Kington