Matplotlib子图具有相同的“设置”

6

我正在以两种不同的格式绘制相同的数据:对数比例尺和线性比例尺。

基本上,我想要完全相同的图形,但具有不同的比例尺,一个在另一个之上。

我现在拥有的是这个:

import matplotlib.pyplot as plt

# These are the plot 'settings'
plt.xlabel('Size')
plt.ylabel('Time(s)');
plt.title('Matrix multiplication')

plt.xticks(xl, rotation=30, size='small')
plt.grid(True)

# Settings are ignored when using two subplots

plt.subplot(211)
plt.plot(xl, serial_full, 'r--')
plt.plot(xl, acc, 'bs')
plt.plot(xl, cublas, 'g^')

plt.subplot(212)
plt.yscale('log')
plt.plot(xl, serial_full, 'r--')
plt.plot(xl, acc, 'bs')
plt.plot(xl, cublas, 'g^')

plt.subplot 前的所有“设置”都会被忽略。

我可以让它按照我的意愿工作,但是我必须在每个 subplot 声明后重复所有设置。

有没有一种方法可以同时配置两个子图?

2个回答

14

plt.* 设置通常适用于 matplotlib 的 当前 绘图;使用 plt.subplot,您将开始一个新的绘图,因此设置不再适用于它。您可以通过与绘图相关的 Axes 对象(在此处查看示例)共享标签、刻度等,但在我看来这可能会过度使用。相反,我建议将共同的“样式”放入一个函数中,并对每个绘图调用该函数:

def applyPlotStyle():
    plt.xlabel('Size')
    plt.ylabel('Time(s)');
    plt.title('Matrix multiplication')

    plt.xticks(range(100), rotation=30, size='small')
    plt.grid(True)

plt.subplot(211)
applyPlotStyle()
plt.plot(xl, serial_full, 'r--')
plt.plot(xl, acc, 'bs')
plt.plot(xl, cublas, 'g^')

plt.subplot(212)
applyPlotStyle()
plt.yscale('log')
plt.plot(xl, serial_full, 'r--')
plt.plot(xl, acc, 'bs')
plt.plot(xl, cublas, 'g^')

顺便提一句,你可以通过将绘图命令提取到这样一个函数中来消除更多的重复:

def applyPlotStyle():
    plt.xlabel('Size')
    plt.ylabel('Time(s)');
    plt.title('Matrix multiplication')

    plt.xticks(range(100), rotation=30, size='small')
    plt.grid(True)

def plotSeries():
    applyPlotStyle()
    plt.plot(xl, serial_full, 'r--')
    plt.plot(xl, acc, 'bs')
    plt.plot(xl, cublas, 'g^')

plt.subplot(211)
plotSeries()

plt.subplot(212)
plt.yscale('log')
plotSeries()

另外一方面,将标题放在图的顶部(而不是在每个图上方)可能已经足够了,例如使用suptitle。同样,xlabel只需出现在第二个图下方即可。
def applyPlotStyle():
    plt.ylabel('Time(s)');

    plt.xticks(range(100), rotation=30, size='small')
    plt.grid(True)

def plotSeries():
    applyPlotStyle()
    plt.plot(xl, serial_full, 'r--')
    plt.plot(xl, acc, 'bs')
    plt.plot(xl, cublas, 'g^')

plt.suptitle('Matrix multiplication')
plt.subplot(211)
plotSeries()

plt.subplot(212)
plt.yscale('log')
plt.xlabel('Size')
plotSeries()

plt.show()
5
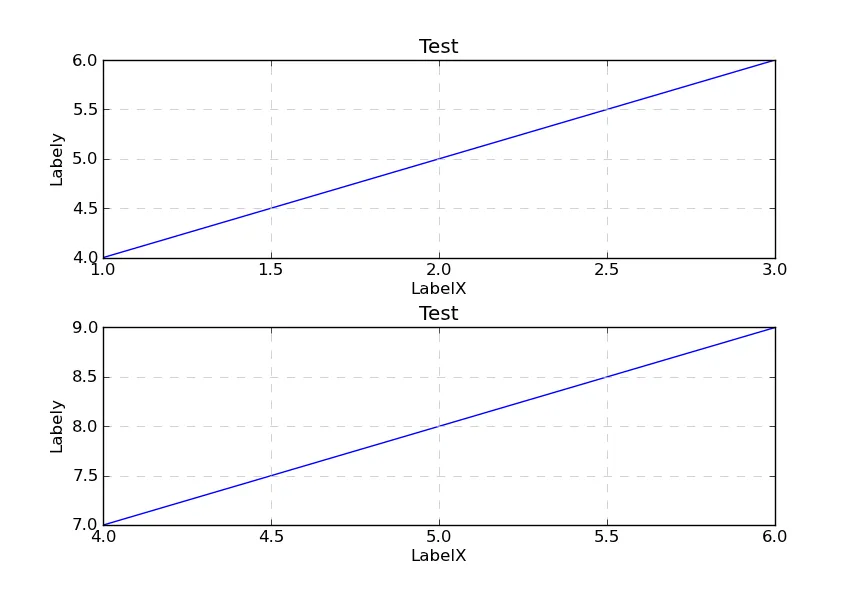
汉斯的回答可能是推荐的方法。但是如果您仍然希望复制轴属性到另一个轴,请参考我发现的以下方法:
fig = figure()
ax1 = fig.add_subplot(2,1,1)
ax1.plot([1,2,3],[4,5,6])
title('Test')
xlabel('LabelX')
ylabel('Labely')

ax2 = fig.add_subplot(2,1,2)
ax2.plot([4,5,6],[7,8,9])


for prop in ['title','xlabel','ylabel']:
    setp(ax2,prop,getp(ax1,prop))

show()
fig.show()

enter image description here

这让您可以设置白名单,以确定要设置的属性,目前我有 title, xlabelylabel,但您可以使用 getp(ax1) 来打印可用属性的列表。

您可以使用以下类似的方法复制所有属性,但我建议不要这样做,因为某些属性设置会破坏第二个图。我试图使用黑名单来排除一些属性,但您需要调整它才能使其正常工作:

insp = matplotlib.artist.ArtistInspector(ax1)
props = insp.properties()
for key, value in props.iteritems():
    if key not in ['position','yticklabels','xticklabels','subplotspec']:
        try:
            setp(ax2,key,value)
        except AttributeError:
            pass

except/pass 是为了跳过那些可读但不可写的属性)

1
我编辑了你的 try 块,这样它就不会捕获任何意外错误了。(编辑已在审核队列中。) - Joooeey

网页内容由stack overflow 提供, 点击上面的
可以查看英文原文,
原文链接