我有一个包含三个子图的图像。第一个子图是一张图片(imshow),而其他两个子图是分布图(plot)。
以下是代码:
# collects data
imgdata = ...      # img of shape  (800, 1600, 3)
x = ...            # one 1600-dimensional vector
y = ...            # one  800-dimensional vector

# create the figure
f = plt.figure()

# create subplots
subplot_dim = (1, 3)
p_img = plt.subplot2grid(subplot_dim, (0, 0), aspect="auto")
p_x = plt.subplot2grid(subplot_dim, (0, 1), aspect="auto")
p_y = plt.subplot2grid(subplot_dim, (0, 2), aspect="auto")

p_img.imshow(imgdata, interpolation="None")
p_x.plot(x)
p_y.plot(y)


# save figure
f.set_size_inches(21.0, 12.0)
f.savefig("some/path/image.pdf", dpi=80)
我的问题是,两个子图p_x和p_y的高度始终大于图像子图p_img。
因此,结果总是看起来像这样:
                  ###############   ###############
                  #             #   #  *****      #
                  #        *****#   # *     *     #
###############   #     ***     #   # *      *    #
#             #   #    *        #   # *        *  #
#    image    #   #   *         #   #*           *#
#             #   #***          #   #*           *#
###############   ###############   ###############
     p_img              p_x               p_y
我该如何强制使、和的大小(至少是高度)相等?
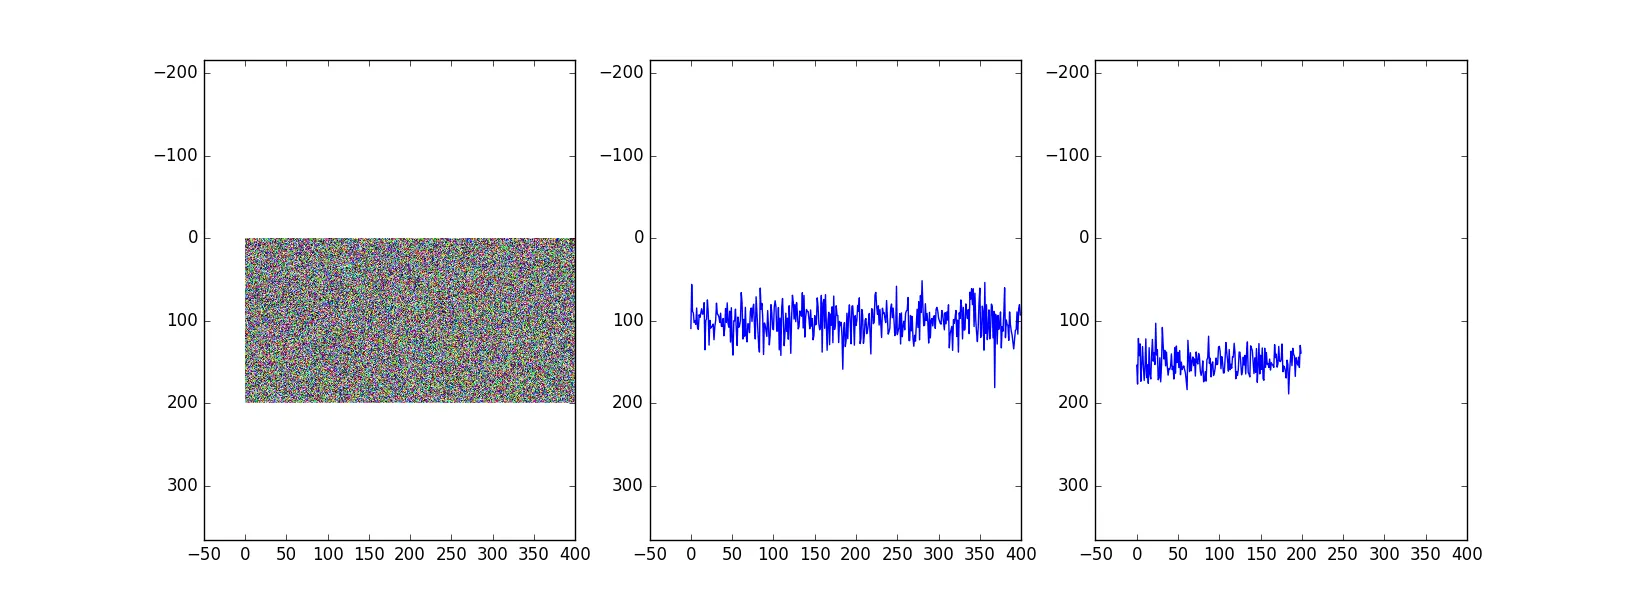
编辑:这里有一个简单的示例代码,可生成随机数据并使用plt.show()而不是保存图像。然而,人们很容易看到同样的行为:图像比其他子图小得多(高度)。
from matplotlib import pyplot as plt
from matplotlib import image as mpimg
import numpy as np

imgdata = np.random.rand(200, 400, 3)
x = np.random.normal(loc=100.0, scale=20.0, size=400)
y = np.random.normal(loc=150.0, scale=15.0, size=200)

# create the figure
f = plt.figure()

# create subplots
subplot_dim = (1, 3)
p_img = plt.subplot2grid(subplot_dim, (0, 0), aspect="auto")
p_x = plt.subplot2grid(subplot_dim, (0, 1), aspect="auto")
p_y = plt.subplot2grid(subplot_dim, (0, 2), aspect="auto")

p_img.imshow(imgdata, interpolation="None")
p_x.plot(x)
p_y.plot(y)


# save figure
plt.show()
plt.axis()函数来设置坐标轴的尺寸。 - SvbZ3r0axis()不是接受一个列表[xmin,xmax,ymin,ymax]吗?p_img,p_x和p_y有一个(成对)不同的 y 轴。p_img(图像的高度)为800,而p_x和p_y的y_max通常在区间 [1,10] 中。因此它们永远不共享 y 轴(缩放)。 - daniel451gridspec是什么?请查看这个问题,看看它是否有帮助。 - SvbZ3r0