子图中的子图 Matplotlib / Seaborn

3

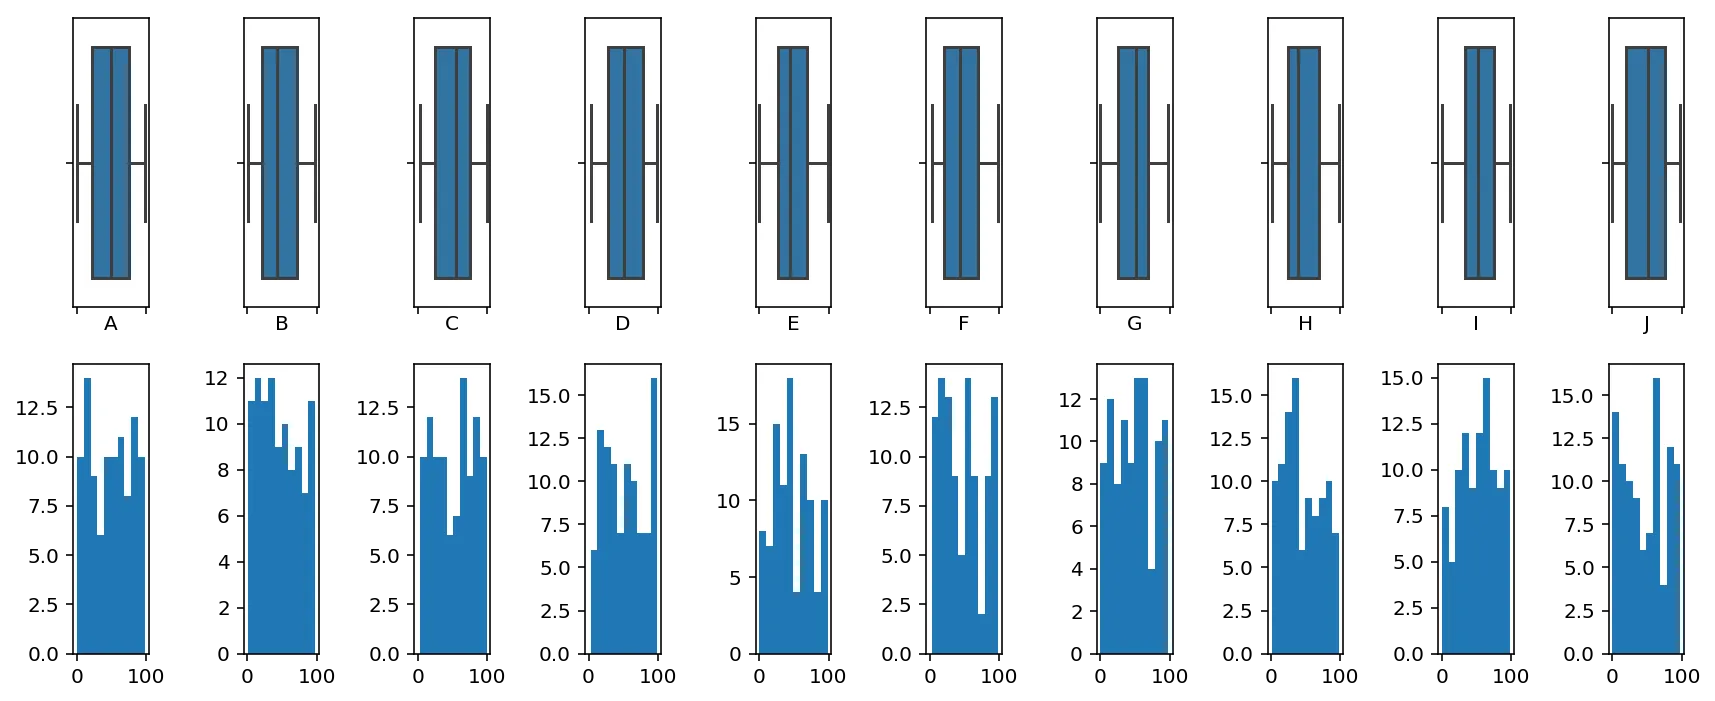
我正在尝试创建一个子图网格。每个子图将类似于此网站上的子图。

https://python-graph-gallery.com/24-histogram-with-a-boxplot-on-top-seaborn/

如果我有10个不同的这种类型的图,我想将它们变成一个5x2的图表。
我已经阅读了Matplotlib的文档,但似乎无法弄清如何做到这一点。我可以循环子图并输出每个子图,但我无法将其制成行和列。
导入pandas和numpy库,以及seaborn库。
df = pd.DataFrame(np.random.randint(0,100,size=(100, 10)),columns=list('ABCDEFGHIJ'))

for c in df :
    # Cut the window in 2 parts
    f, (ax_box,
        ax_hist) = plt.subplots(2,
                                sharex=True,
                                gridspec_kw={"height_ratios":(.15, .85)},
                                figsize = (10, 10))
    # Add a graph in each part
    sns.boxplot(df[c], ax=ax_box)
    ax_hist.hist(df[c])
    # Remove x axis name for the boxplot
plt.show()

结果将把这个循环中的数据放入一个行列集合中,本例中为5x2。
1个回答

6
你有 10 列数据,每列需要创建 2 个子图:一个箱线图和一个直方图。因此你需要总共 20 个图。可以通过创建一个 2 行 10 列的网格来实现。

完整答案:(根据个人口味调整 figsizeheight_ratios

import pandas as pd
import seaborn as sns
import numpy as np
import matplotlib.pyplot as plt

f, axes = plt.subplots(2, 10, sharex=True, gridspec_kw={"height_ratios":(.35, .35)}, 
                                    figsize = (12, 5))

df = pd.DataFrame(np.random.randint(0,100,size=(100, 10)),columns=list('ABCDEFGHIJ'))

for i, c in enumerate(df):
    sns.boxplot(df[c], ax=axes[0,i])
    axes[1,i].hist(df[c])
plt.tight_layout()
plt.show()

enter image description here


这太完美了。我只是将 shares = False 更改为仅使相应的箱线图和直方图共享 x,而不是所有的图表都共享。这对我来说似乎有效。 - Randy

网页内容由stack overflow 提供, 点击上面的
可以查看英文原文,
原文链接