Matplotlib如何在imshow图中居中/对齐刻度线?

5

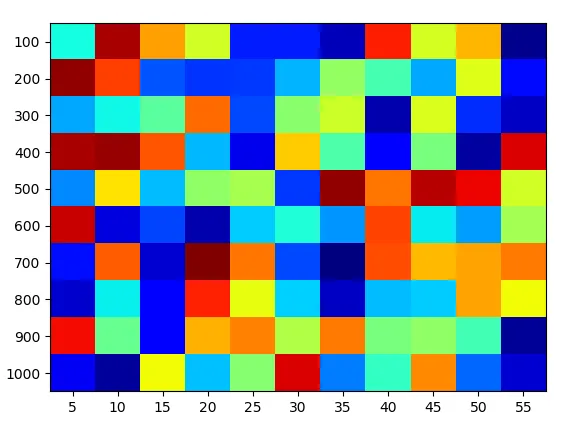
我一直在尝试将imshow的x和y轴刻度居中,但没有成功。

期望的yticks为:[100, 200, 300, 400, 500, 600, 700, 800, 900, 1000],而xticks为:[5, 10, 15, 20, 25, 30, 35, 40, 45, 50, 55],但需要对齐/居中。例如,第一行应该将值100正好放在行空间(黄色框/像素)的中间。

import numpy as np
import matplotlib.pyplot as plt

X = np.random.rand(10,11)
plt.figure(dpi=130)
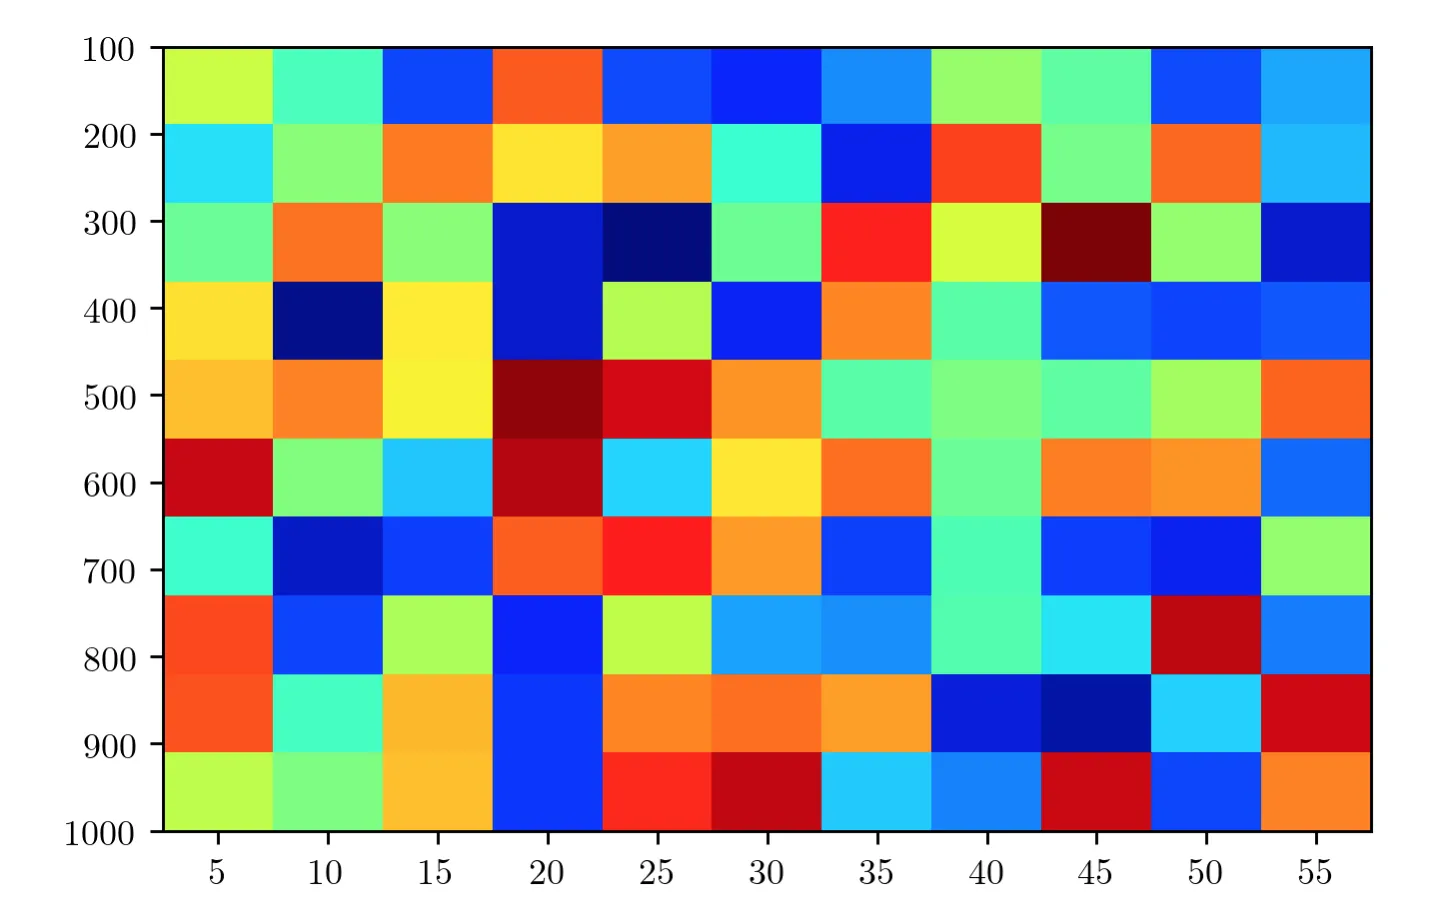
plt.imshow(X, cmap = 'jet', interpolation=None, extent=[5,55,1000,100], aspect='auto')

这里,值 5x 轴 上根本没有出现。

enter image description here

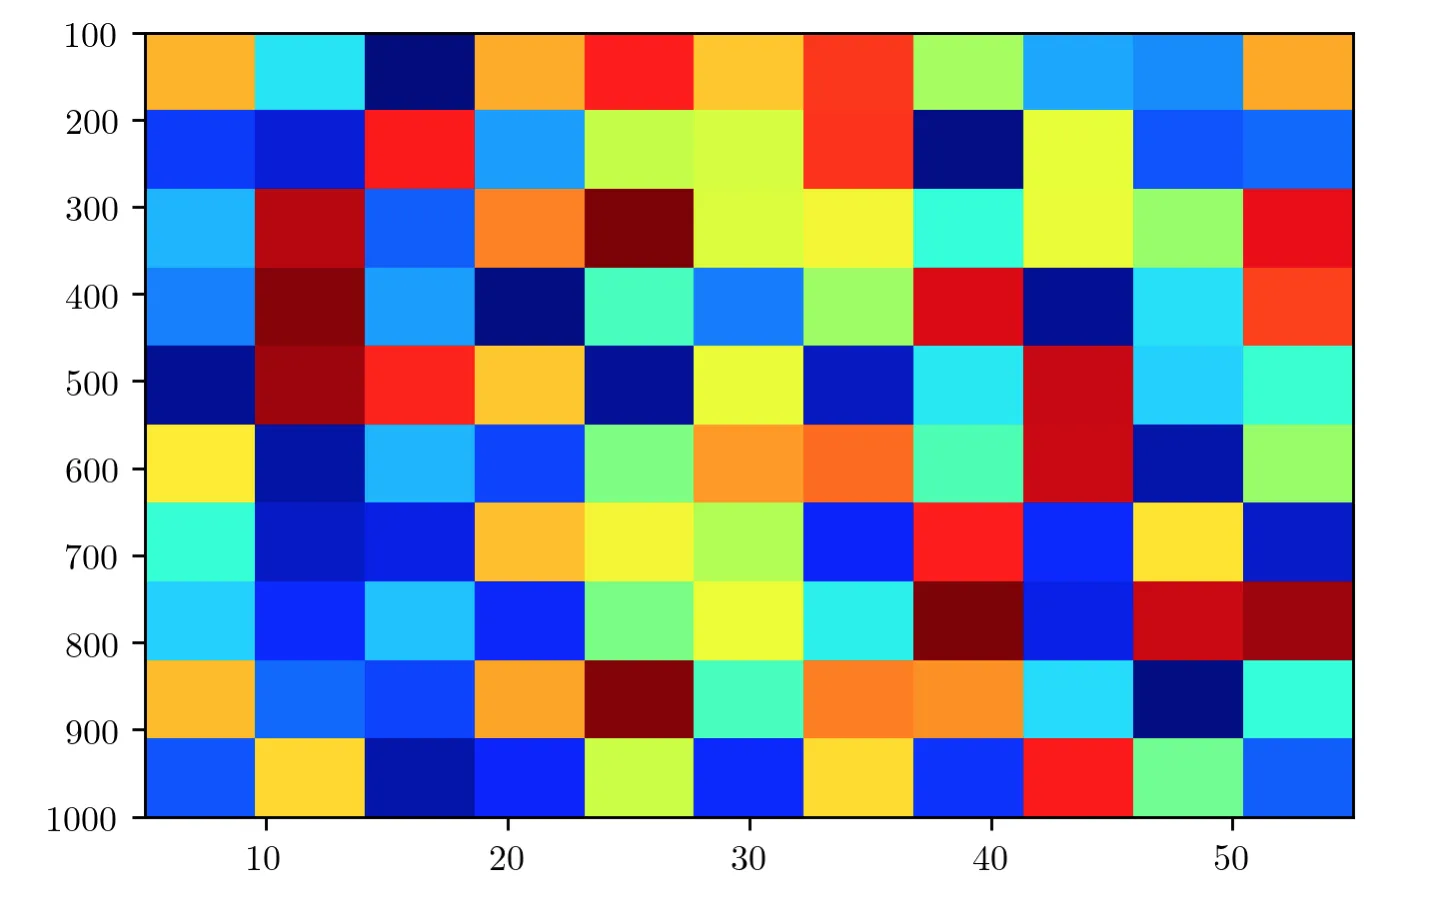
我也尝试了以下方法,x 轴没问题,但 y 轴有问题。

plt.figure(dpi=130)
X = np.random.rand(10,11)
plt.imshow(X, cmap = 'jet', interpolation=None, extent=[2.5,57.5,1000,100], aspect='auto')
ax = plt.gca()
xticks = cluster_space
yticks = space_segment
ax.set_xticks(xticks)
ax.set_yticks(yticks)

enter image description here


你想让你的轴从0到60,从50到1050,对吗?你试过这些值了吗? - ImportanceOfBeingErnest
不,我希望轴在我在原始帖子中提到的范围内。但是我需要刻度(值)完美地居中于每条线上。以100为例。我需要100的值出现在黄色框/像素的中间。 - seralouk
这是矛盾的。但请检查我的答案,如果不符合您的要求,您可以解释一下应该是什么样子。 - ImportanceOfBeingErnest
1个回答

6

一般而言,要使像素居中,需要将范围设置为从最低像素坐标减去半个像素宽度到最高像素坐标加上半个像素宽度。

import numpy as np; np.random.seed(42)
import matplotlib.pyplot as plt

X = np.random.rand(10,11)
plt.figure()

centers = [5,55,1000,100]
dx, = np.diff(centers[:2])/(X.shape[1]-1)
dy, = -np.diff(centers[2:])/(X.shape[0]-1)
extent = [centers[0]-dx/2, centers[1]+dx/2, centers[2]+dy/2, centers[3]-dy/2]
plt.imshow(X, cmap = 'jet', interpolation=None, extent=extent, aspect='auto')

plt.xticks(np.arange(centers[0], centers[1]+dx, dx))
plt.yticks(np.arange(centers[3], centers[2]+dy, dy))
plt.show()

enter image description here


这正是我所需要的。 - seralouk

网页内容由stack overflow 提供, 点击上面的
可以查看英文原文,
原文链接