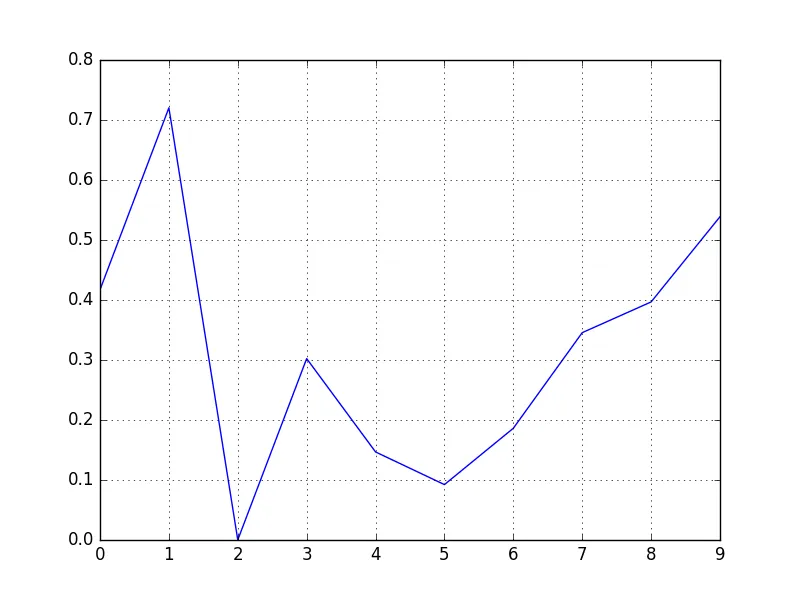
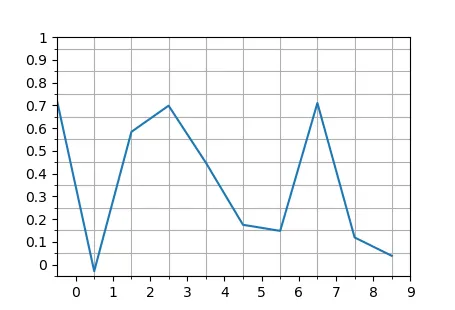
在下面的简单示例中,如何使x轴刻度值出现在网格之间?
import numpy as np
import matplotlib.pyplot as plt

np.random.seed(1)
x = range(10)
y = np.random.random(10)
plt.plot(x,y)
plt.xticks(x)
plt.grid(True)
plt.show()
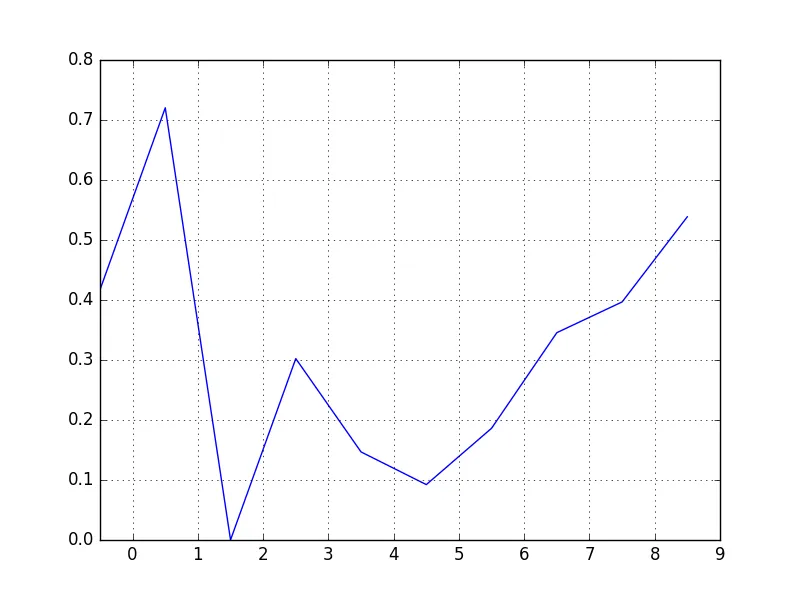
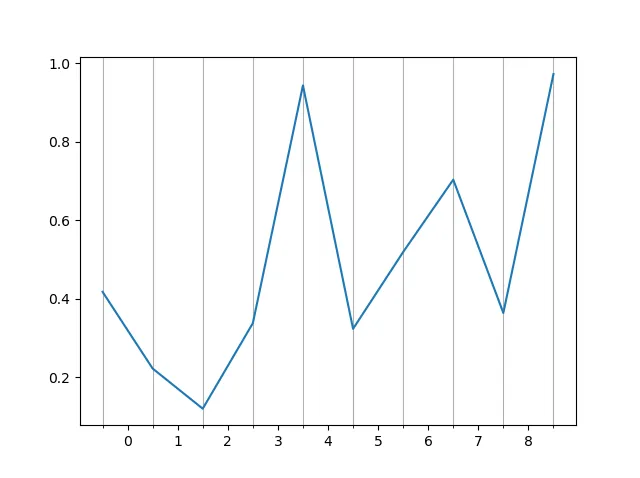
np.random.seed(1)
x = range(10)
y = np.random.random(10)
plt.plot(x,y)
plt.xticks(x)
plt.grid(True)
plt.xticks(np.arange(10)+0.5, x)
plt.show()
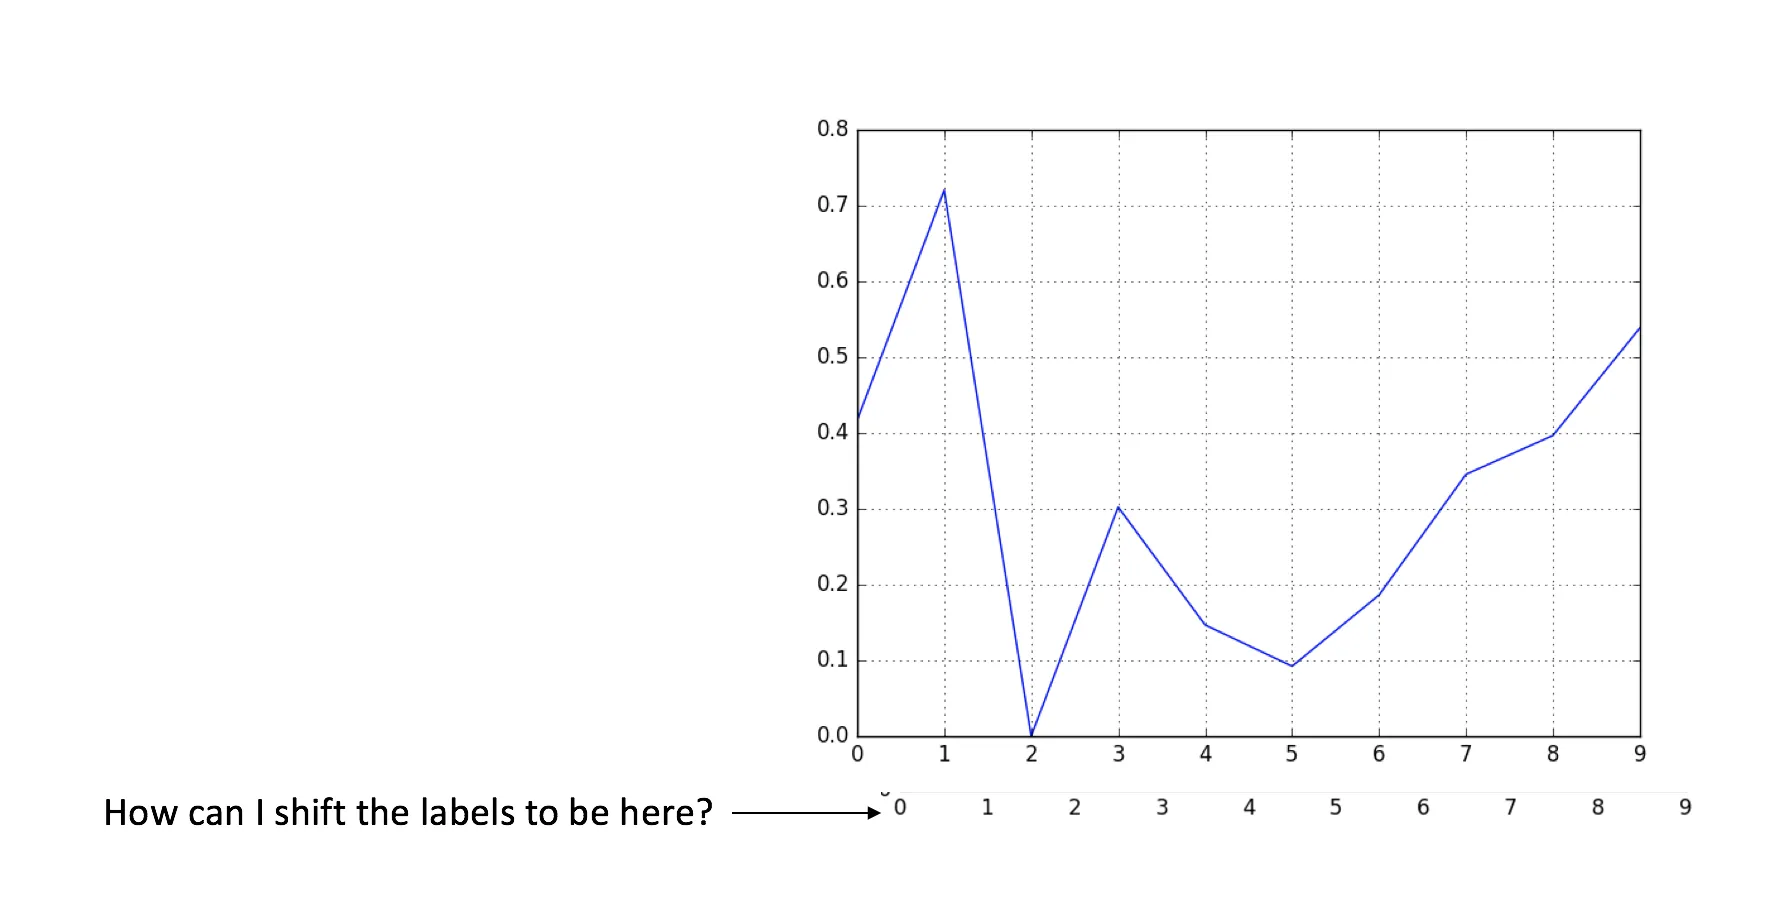
我想要的结果是:
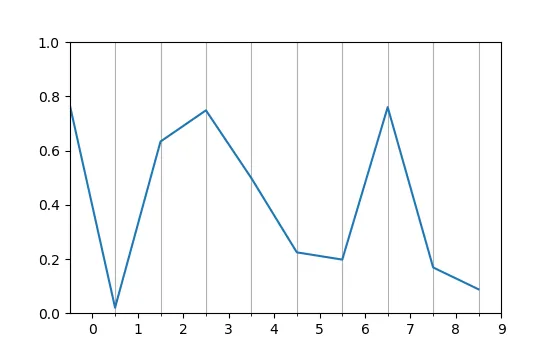
np.random.seed()。 - IMCoins