虽然我能够破解代码来绘制XY图,但我想要一些额外的东西:
- 从X轴向上指定距离延伸的垂直线
- 用文本注释该点,接近必须(请参见红色文本)
- 图表是自包含图像:800长序列应占用800像素宽度(我希望它与特定的图像对齐,因为它是强度图)
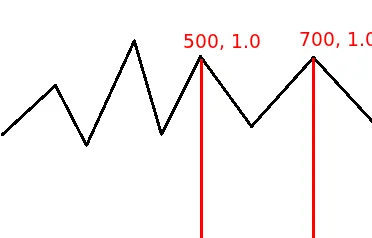
我如何在mathplotlib中制作这样的图形?
虽然我能够破解代码来绘制XY图,但我想要一些额外的东西:
我如何在mathplotlib中制作这样的图形?
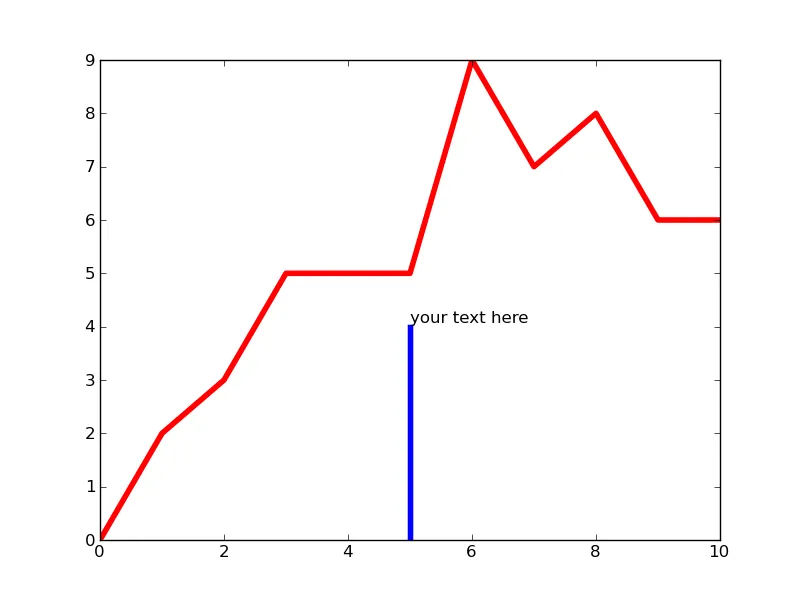
import matplotlib.pyplot as plt

fig = plt.figure()
ax = fig.add_subplot(1, 1, 1)
data = (0, 2, 3, 5, 5, 5, 9, 7, 8, 6, 6)
ax.plot(data, 'r-', linewidth=4)

plt.axvline(x=5, ymin=0, ymax=4.0 / max(data), linewidth=4)
plt.text(5, 4, 'your text here')
plt.show()
ymin和ymax值从0到1变化,因此需要将其标准化到轴上。
编辑:问答者已修改代码以使其更具面向对象特征:
fig = plt.figure()
data = (0, 2, 3, 5, 5, 5, 9, 7, 8, 6, 6)

ax = fig.add_subplot(1, 1, 1)
ax.plot(data, 'r-', linewidth=4)
ax.axvline(x=5, ymin=0, ymax=4.0 / max(data), linewidth=4)
ax.text(5, 4, 'your text here')
fig.show()
figsize和dpi参数。因此,您可以轻松设置大小,还可能希望关闭坐标轴。 - fraxel