我有从Unix纪元开始的秒数。我想在24小时钟上绘制它们。到目前为止,我的尝试是:
from __future__ import division
import matplotlib.pyplot as plt
import numpy as np
angles = 2*np.pi*np.random.randint(0,864000,100)/86400
ax = plt.subplot(111, polar=True)
ax.scatter(angles, np.ones(100)*1)
plt.show()
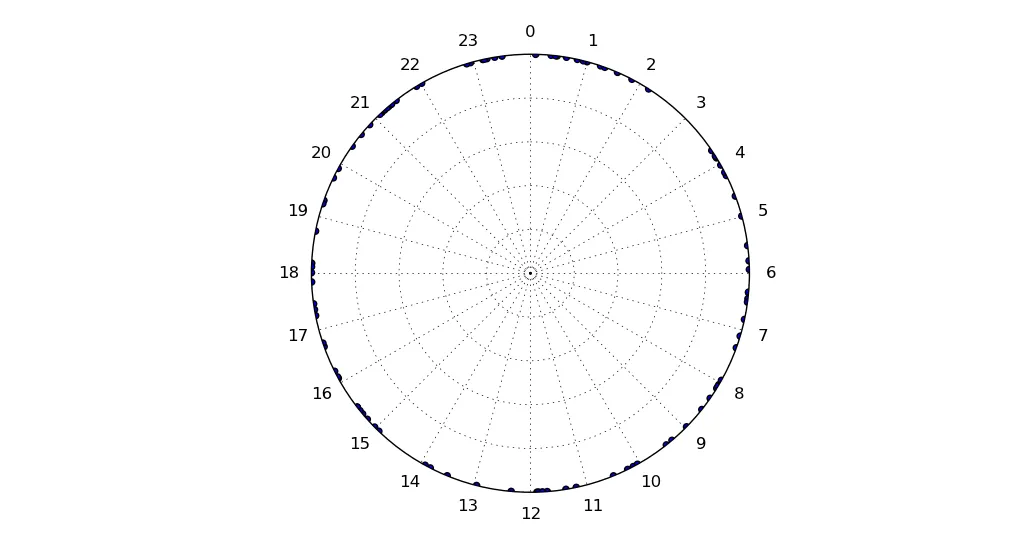
这会得到以下结果:
- 如何将点放在圆周上而不是内部(或者至少将它们移得离中心更远)?
- 如何将标签从角度更改为时间?
- 如何摆脱
0.2, 0.4, ...? - 基本上,如何使它看起来更像钟表上标记的点?