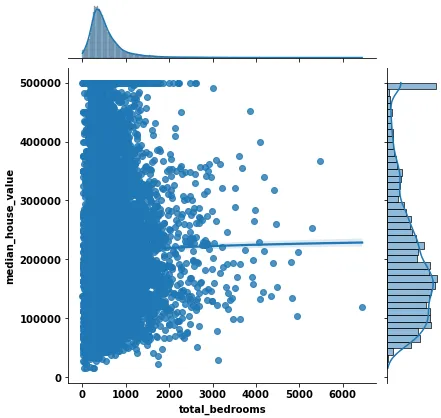
如何在seaborn jointplot中将轴设置为对数刻度?我无法在
seaborn.jointplot中找到任何对数参数。
笔记本
import seaborn as sns
import pandas as pd

df = pd.read_csv("https://storage.googleapis.com/mledu-datasets/california_housing_train.csv", sep=",")

g = sns.jointplot(x="total_bedrooms",
              y="median_house_value",
              data = df,
              kind="reg",
              logx=True
              )
- 涉及列的300行样本数据,以防数据链接失效
median_house_value,total_bedrooms
66900.0,1283.0
80100.0,1901.0
85700.0,174.0
73400.0,337.0
65500.0,326.0
74000.0,236.0
82400.0,680.0
48500.0,168.0
58400.0,1175.0
48100.0,309.0
86500.0,801.0
62000.0,483.0
48600.0,248.0
70400.0,464.0
45000.0,378.0
69100.0,587.0
94900.0,322.0
25000.0,33.0
44000.0,386.0
27500.0,24.0
44400.0,360.0
59200.0,243.0
50000.0,95.0
71300.0,129.0
53500.0,397.0
100000.0,139.0
71100.0,322.0
80900.0,270.0
68600.0,191.0
74300.0,294.0
65800.0,394.0
67500.0,262.0
146300.0,196.0
113800.0,171.0
95800.0,113.0
107800.0,220.0
40000.0,373.0
88500.0,246.0
91200.0,666.0
102800.0,104.0
64000.0,389.0
84700.0,440.0
70100.0,573.0
142500.0,72.0
88400.0,913.0
75500.0,492.0
43300.0,523.0
46700.0,218.0
63700.0,287.0
72700.0,610.0
42500.0,136.0
53400.0,283.0
60800.0,262.0
58600.0,382.0
66400.0,366.0
67500.0,387.0
79200.0,337.0
63100.0,275.0
67700.0,581.0
40000.0,199.0
62200.0,634.0
70700.0,340.0
60300.0,545.0
61200.0,325.0
69400.0,373.0
96000.0,268.0
60600.0,395.0
70800.0,454.0
60400.0,403.0
143000.0,365.0
80800.0,530.0
67500.0,316.0
61000.0,142.0
59600.0,221.0
53600.0,162.0
84300.0,606.0
107200.0,480.0
59400.0,416.0
63900.0,375.0
69400.0,328.0
62500.0,835.0
58300.0,438.0
70800.0,490.0
86200.0,202.0
76200.0,283.0
140300.0,217.0
62300.0,269.0
63500.0,256.0
61100.0,301.0
67500.0,289.0
93800.0,594.0
73600.0,208.0
97200.0,235.0
87500.0,279.0
71700.0,282.0
96300.0,143.0
87500.0,203.0
64400.0,507.0
110100.0,414.0
90800.0,274.0
159900.0,307.0
94400.0,177.0
72500.0,187.0
83200.0,317.0
62000.0,244.0
61200.0,231.0
125000.0,235.0
55200.0,340.0
87500.0,99.0
50000.0,238.0
30000.0,448.0
87500.0,103.0
93800.0,81.0
47500.0,18.0
68900.0,379.0
41000.0,1257.0
32500.0,49.0
62800.0,248.0
67500.0,95.0
67500.0,272.0
58800.0,43.0
53800.0,25.0
54400.0,81.0
53800.0,46.0
54300.0,536.0
51300.0,57.0
43900.0,280.0
66400.0,958.0
62800.0,515.0
94500.0,97.0
65600.0,65.0
81300.0,94.0
66900.0,290.0
66800.0,2331.0
76100.0,89.0
65600.0,1997.0
84700.0,354.0
100000.0,820.0
47800.0,1228.0
82600.0,705.0
112500.0,54.0
65400.0,499.0
61400.0,277.0
65900.0,800.0
47500.0,203.0
58600.0,512.0
155000.0,19.0
66700.0,654.0
67500.0,476.0
60600.0,625.0
96300.0,273.0
61800.0,409.0
68200.0,192.0
68900.0,714.0
82200.0,787.0
100000.0,176.0
100900.0,295.0
32900.0,386.0
42500.0,468.0
69400.0,858.0
68500.0,352.0
58800.0,258.0
124700.0,849.0
72100.0,221.0
76900.0,1326.0
90000.0,1349.0
104100.0,566.0
93400.0,1039.0
95000.0,2224.0
67500.0,187.0
50000.0,91.0
92900.0,444.0
382400.0,1222.0
83700.0,284.0
65800.0,109.0
199300.0,2555.0
167400.0,760.0
137500.0,481.0
55400.0,556.0
93400.0,410.0
91800.0,851.0
98000.0,831.0
54200.0,487.0
81000.0,861.0
100000.0,367.0
57400.0,411.0
158500.0,3923.0
353100.0,2000.0
176400.0,514.0
62300.0,406.0
110700.0,606.0
78500.0,3098.0
121300.0,1859.0
318100.0,1542.0
98700.0,1152.0
65000.0,1238.0
116300.0,348.0
194500.0,3479.0
134500.0,2405.0
258100.0,2460.0
73300.0,1149.0
74400.0,2257.0
128000.0,1618.0
238800.0,2007.0
78000.0,1089.0
97800.0,872.0
259200.0,500.0
168800.0,476.0
177800.0,893.0
285000.0,1260.0
341700.0,2837.0
138300.0,782.0
103100.0,48.0
84000.0,1296.0
115100.0,1343.0
500001.0,438.0
98100.0,361.0
72400.0,1303.0
88400.0,1266.0
97500.0,1110.0
403300.0,249.0
99100.0,1206.0
134600.0,992.0
127100.0,643.0
104200.0,920.0
83000.0,745.0
65300.0,1234.0
85200.0,471.0
142500.0,1512.0
90900.0,2481.0
113600.0,441.0
81000.0,913.0
145200.0,2020.0
115300.0,272.0
65900.0,636.0
148900.0,1875.0
146400.0,868.0
66600.0,1882.0
87500.0,85.0
94800.0,1229.0
248100.0,1074.0
64700.0,713.0
51300.0,2634.0
61100.0,1395.0
66000.0,780.0
61000.0,306.0
89600.0,754.0
112500.0,1444.0
130400.0,859.0
145200.0,2315.0
189900.0,852.0
68200.0,648.0
125200.0,763.0
110900.0,2186.0
159000.0,1839.0
220500.0,463.0
124100.0,1714.0
199400.0,1217.0
183900.0,1387.0
235600.0,1780.0
500001.0,562.0
69600.0,1529.0
321900.0,399.0
148200.0,361.0
22500.0,1743.0
76600.0,67.0
50000.0,166.0
230200.0,1652.0
345500.0,82.0
116500.0,876.0
113500.0,827.0
172900.0,365.0
198100.0,538.0
67400.0,1719.0
169100.0,847.0
240600.0,157.0
193800.0,74.0
161100.0,711.0
156300.0,374.0
66300.0,109.0
81700.0,875.0
122900.0,682.0
214300.0,661.0
158200.0,946.0
143400.0,1070.0
217400.0,845.0
308600.0,481.0
111400.0,849.0
42500.0,10.0
173400.0,268.0
187200.0,702.0
214500.0,751.0
63000.0,525.0
221000.0,1946.0
90000.0,68.0
231800.0,786.0
206100.0,520.0
100000.0,63.0
274600.0,565.0
84700.0,1527.0