我正在尝试编辑刻度标签,但是即使设置了刻度,我仍然得到科学计数法。以下是一个最小可行示例:
import matplotlib.pyplot as plt

fig, ax = plt.subplots(figsize=(9, 7))
fig.subplots_adjust(left=0.11, right=0.95, top=0.94)

ax.ticklabel_format(style='plain')

plt.plot([1,4],[3,6] )

ax.set_yscale('log')
ax.set_xscale('log')

ax.set_xticks([0.7,1,1.5,2,2.5,3,4,5])

ax.get_xaxis().set_major_formatter(matplotlib.ticker.ScalarFormatter())
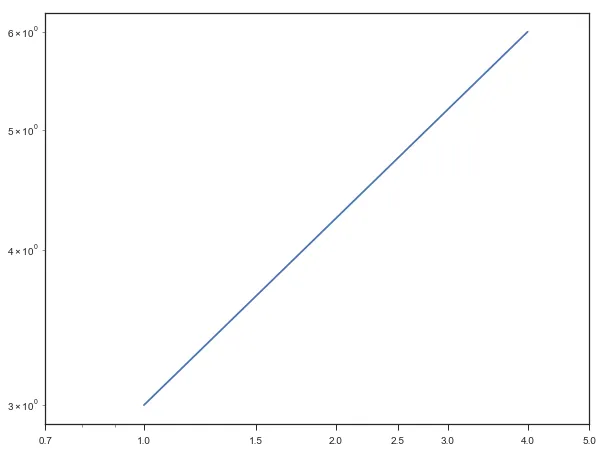
这会产生下面这个图:
如你所见,ax.ticklabel_format(style='plain') 并不起作用,因为我仍然得到科学计数法的刻度标签,而当使用 ax.set_xticks 时,旧的刻度标签仍然存在。我查看了 此主题,看起来问题在于选择刻度,如果我使用例如 0.3 而不是 0.7 作为第一个刻度,它就可以工作,但是我需要在这个特定范围内使用对数刻度作图。
有何解决方法?