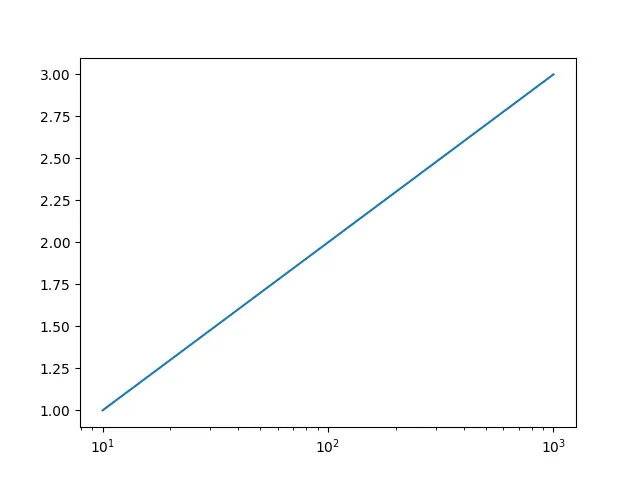
看起来在对数刻度下 set_xticks 不起作用:
from matplotlib import pyplot as plt
fig1, ax1 = plt.subplots()
ax1.plot([10, 100, 1000], [1,2,3])
ax1.set_xscale('log')
ax1.set_xticks([20, 200, 500])
plt.show()
可能吗?
看起来在对数刻度下 set_xticks 不起作用:
from matplotlib import pyplot as plt
fig1, ax1 = plt.subplots()
ax1.plot([10, 100, 1000], [1,2,3])
ax1.set_xscale('log')
ax1.set_xticks([20, 200, 500])
plt.show()
可能吗?
import matplotlib
from matplotlib import pyplot as plt
fig1, ax1 = plt.subplots()
ax1.plot([10, 100, 1000], [1,2,3])
ax1.set_xscale('log')
ax1.set_xticks([20, 200, 500])
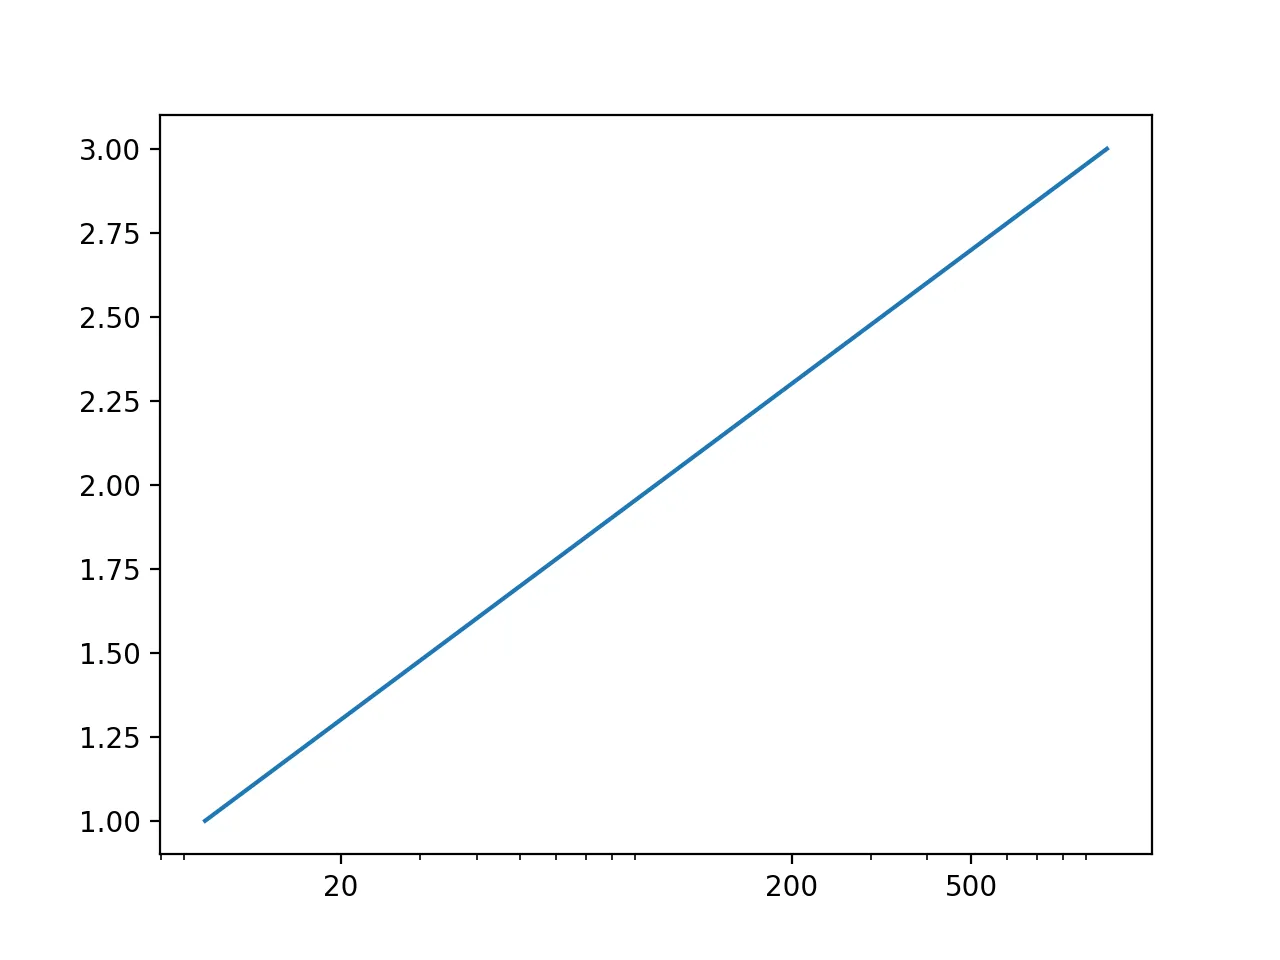
ax1.get_xaxis().set_major_formatter(matplotlib.ticker.ScalarFormatter())
ax1.get_xaxis().get_major_formatter().labelOnlyBase = False
plt.show()
我将添加几个图,并展示如何移除次要刻度:
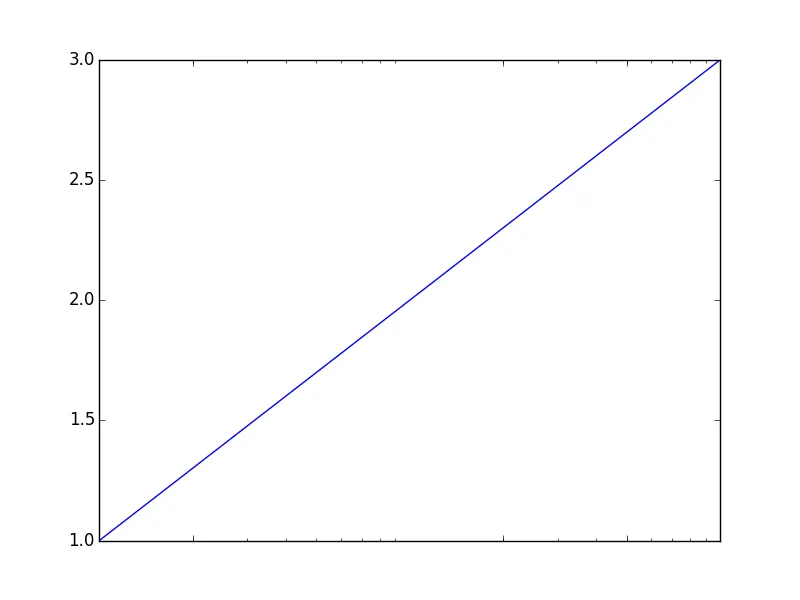
原帖:
from matplotlib import pyplot as plt

fig1, ax1 = plt.subplots()
ax1.plot([10, 100, 1000], [1,2,3])
ax1.set_xscale('log')
ax1.set_xticks([20, 300, 500])
plt.show()
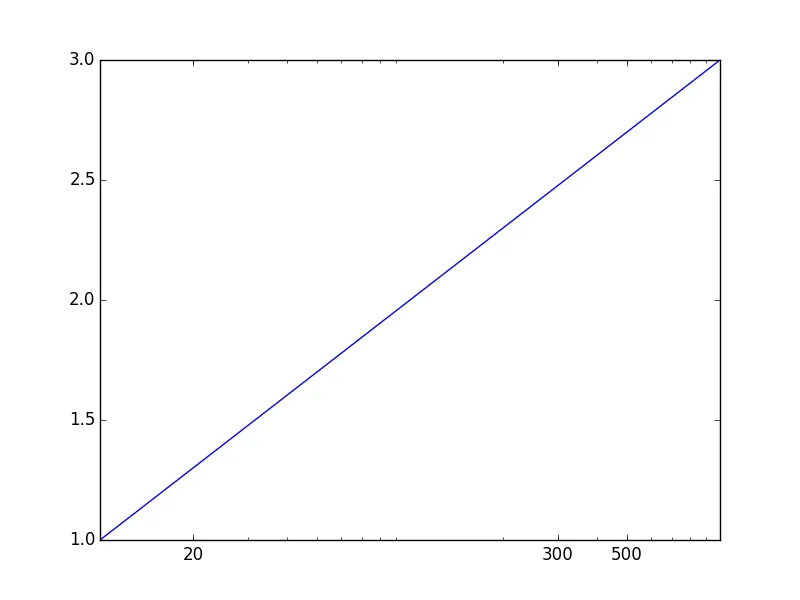
如tcaswell所指出的那样,要添加特定的刻度值,您可以使用matplotlib.ticker.ScalarFormatter:
from matplotlib import pyplot as plt
import matplotlib.ticker

fig1, ax1 = plt.subplots()
ax1.plot([10, 100, 1000], [1,2,3])
ax1.set_xscale('log')
ax1.set_xticks([20, 300, 500])
ax1.get_xaxis().set_major_formatter(matplotlib.ticker.ScalarFormatter())
plt.show()
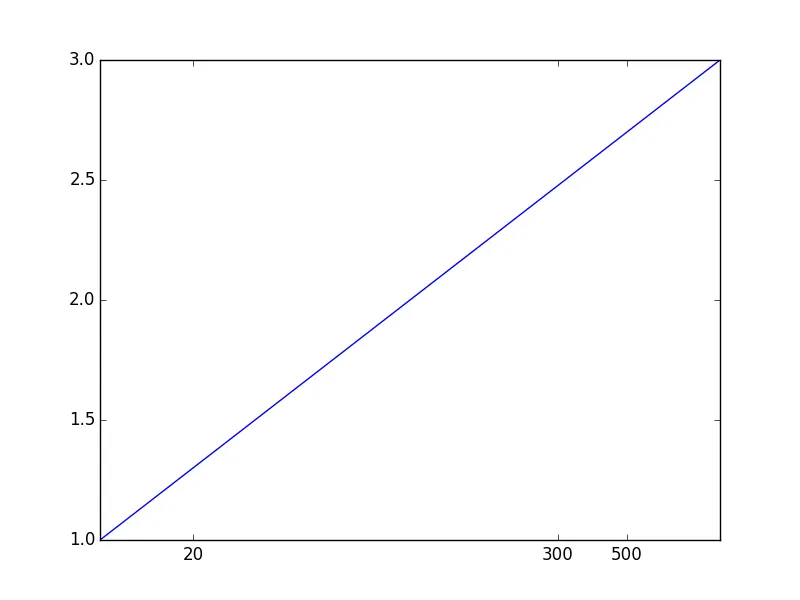
要去除次刻度线,您可以使用matplotlib.rcParams['xtick.minor.size']:
from matplotlib import pyplot as plt
import matplotlib.ticker

matplotlib.rcParams['xtick.minor.size'] = 0
matplotlib.rcParams['xtick.minor.width'] = 0

fig1, ax1 = plt.subplots()
ax1.plot([10, 100, 1000], [1,2,3])
ax1.set_xscale('log')
ax1.set_xticks([20, 300, 500])
ax1.get_xaxis().set_major_formatter(matplotlib.ticker.ScalarFormatter())

plt.show()
你可以使用 ax1.get_xaxis().set_tick_params 来替代,它具有相同的效果(但仅修改当前轴,不像matplotlib.rcParams那样影响所有未来的图形):
from matplotlib import pyplot as plt
import matplotlib.ticker

fig1, ax1 = plt.subplots()
ax1.plot([10, 100, 1000], [1,2,3])
ax1.set_xscale('log')
ax1.set_xticks([20, 300, 500])
ax1.get_xaxis().set_major_formatter(matplotlib.ticker.ScalarFormatter())

ax1.get_xaxis().set_tick_params(which='minor', size=0)
ax1.get_xaxis().set_tick_params(which='minor', width=0)

plt.show()
3x10^1 等仍然存在!我该如何去除它? - Srivatsanfrom matplotlib.ticker import ScalarFormatter, NullFormatter
for axis in [ax.xaxis]:
axis.set_major_formatter(ScalarFormatter())
axis.set_minor_formatter(NullFormatter())
这将取消指数表示法
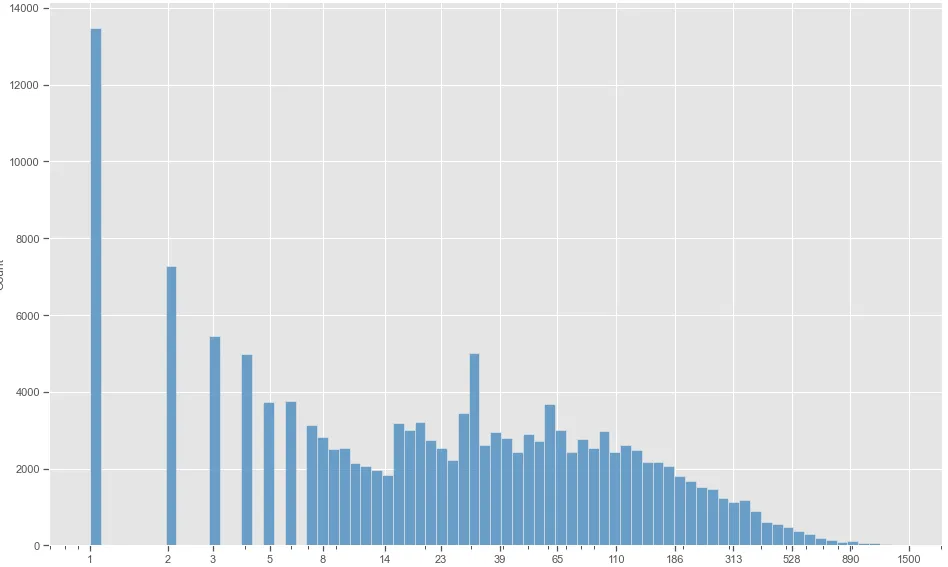
np.geomspace作为xticks。ax = sns.histplot(arr, log_scale=True)
ax.xaxis.set_major_formatter(matplotlib.ticker.ScalarFormatter())
ax.set_xticks( np.geomspace(1, 1500 ,15).round() )
要制作一个x轴为对数刻度的半对数图,有两个选项:
import matplotlib.pyplot as plt
fig, ax = plt.subplots()
ax.plot(x,y)
ax.set_xscale('log')
或者
import matplotlib.pyplot as plt
fig, ax = plt.subplots()
ax.semilogx(x,y)
ax.loglog(x,y)
比
更好。ax.plot(x,y)
ax.set_xscale('log')
ax.set_yscale('log')
当必须设置刻度时;
ax.semilogy(x,y)
比
更好。ax.plot(x,y)
ax.set_yscale('log')
当需要设置刻度时。
from matplotlib import pyplot as plt

fig1, ax1 = plt.subplots()
ax1.plot([10, 100, 1000], [1,2,3])
ax1.set_xscale('log')
ax1.set_xticks([20, 200, 500])
plt.xscale("log")       # <<< !
plt.show()
3x10^1等仍然存在!我该如何删除它? - Srivatsanset_xticks来指定我需要的内容,但只显示了符合基本规范的内容,即使其他内容成为“主要”刻度线。 - physkets