当我绘制水平条形图时,当我手动设置y轴时,我发现x轴和y轴都缺少一个图例,如下所示。
bar_locations = np.arange(6)
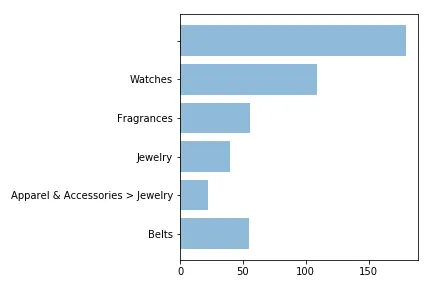
ax.barh(bar_locations, data ,alpha=.5)
bar_locations = np.arange(6)
# data = [55, 22, 40, 56, 109, 180]
# labels = ['others', u'Belts', u'Apparel & Accessories > Jewelry', u'Jewelry', u'Fragrances', u'Watches']
ax.barh(bar_locations, data ,alpha=.5)
ax.set_yticklabels(labels)
fig.tight_layout()
ax.set_xlabel("label")来设置它。 - ImportanceOfBeingErnestax.set_xticks([50,99,137,190])。 - ImportanceOfBeingErnest