如何使得 bar_label 支持新样式的格式化,如百分号、千位分隔符等?
从 matplotlib 3.7 开始
fmt 参数现在直接支持基于 {} 的格式化字符串,例如:
# >= 3.7
plt.bar_label(bars, fmt='{:,.2f}')
#                       ^no f here (not an actual f-string)
在 matplotlib 3.7 之前的版本中
fmt 参数不支持基于 {} 的格式字符串,因此请使用 labels 参数。使用 f-string 格式化柱状图容器的 datavalues,并将其设置为 labels,例如:
plt.bar_label(bars, labels=[f'{x:,.2f}' for x in bars.datavalues])
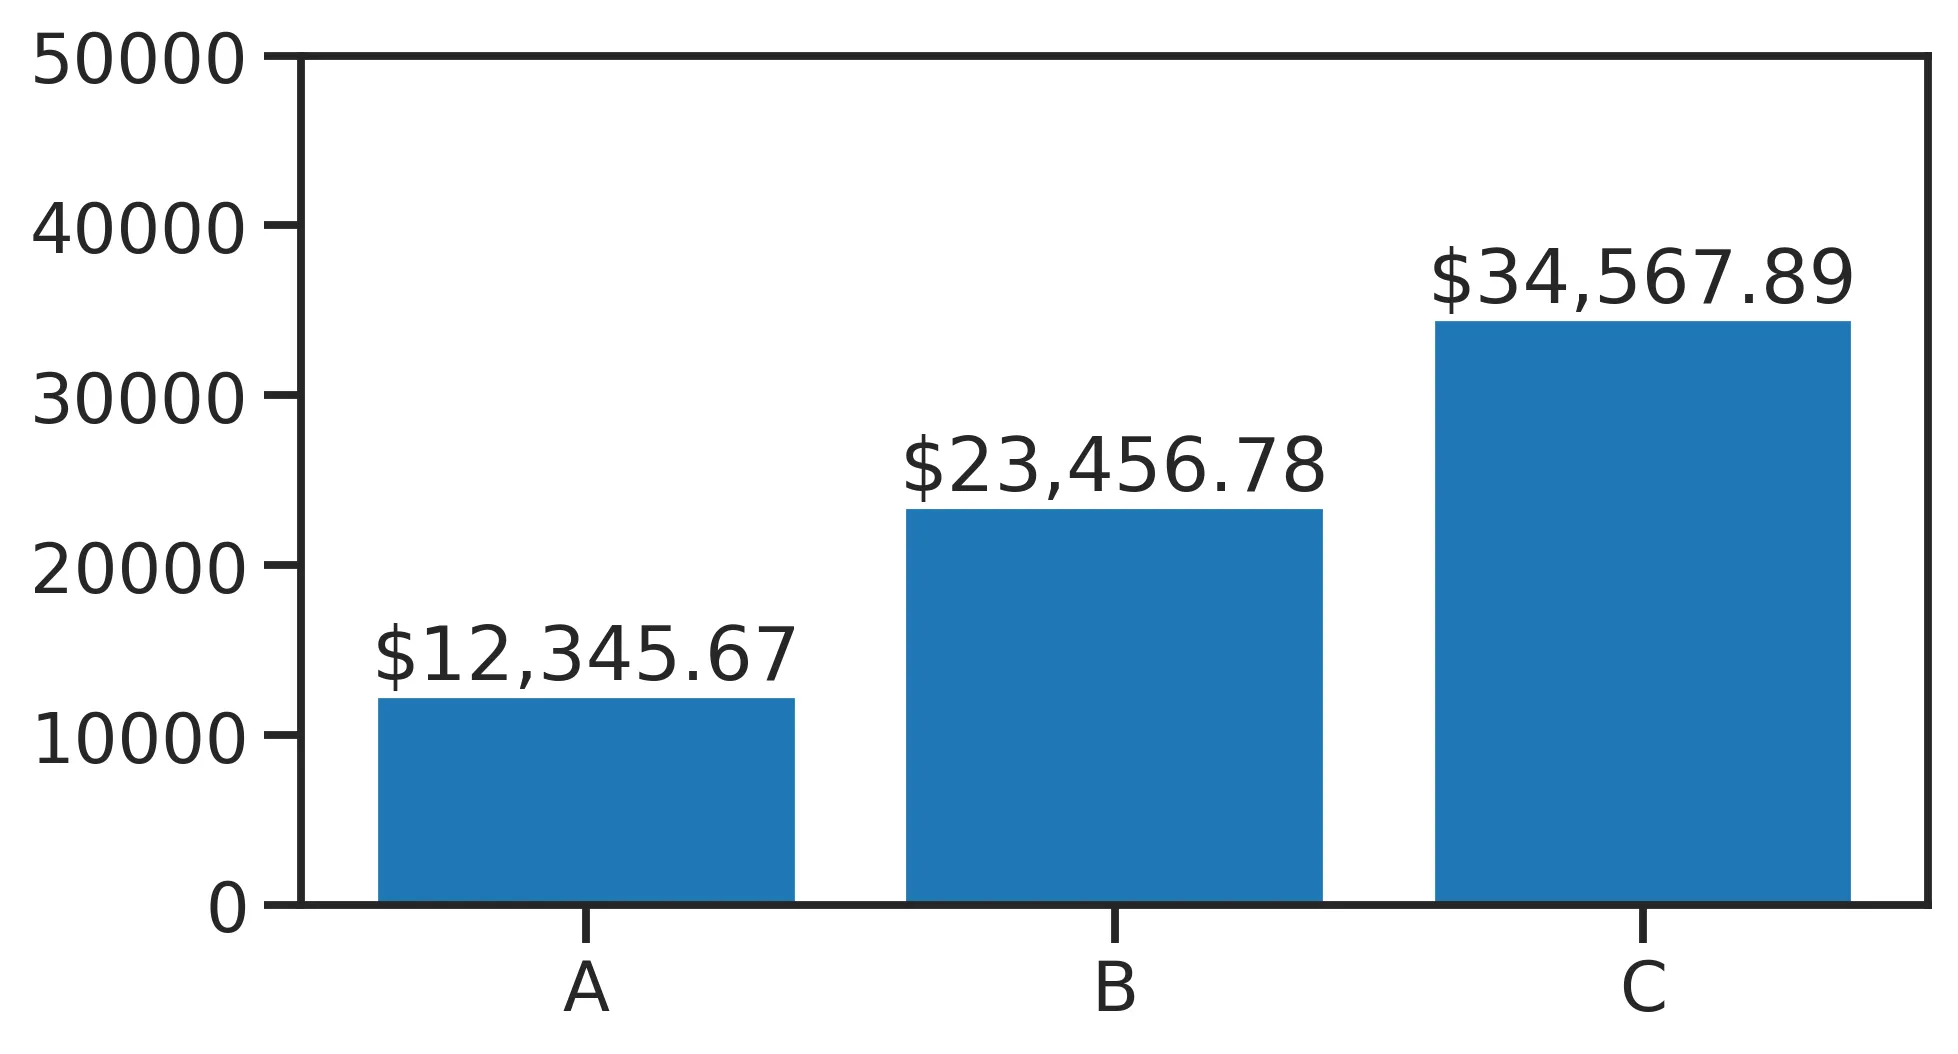
示例:
bars = plt.bar(list('ABC'), [12344.56, 23456.78, 34567.89])

# >= v3.7
plt.bar_label(bars, fmt='${:,.2f}')
plt.bar_label(bars, labels=[f'${x:,.2f}' for x in bars.datavalues])
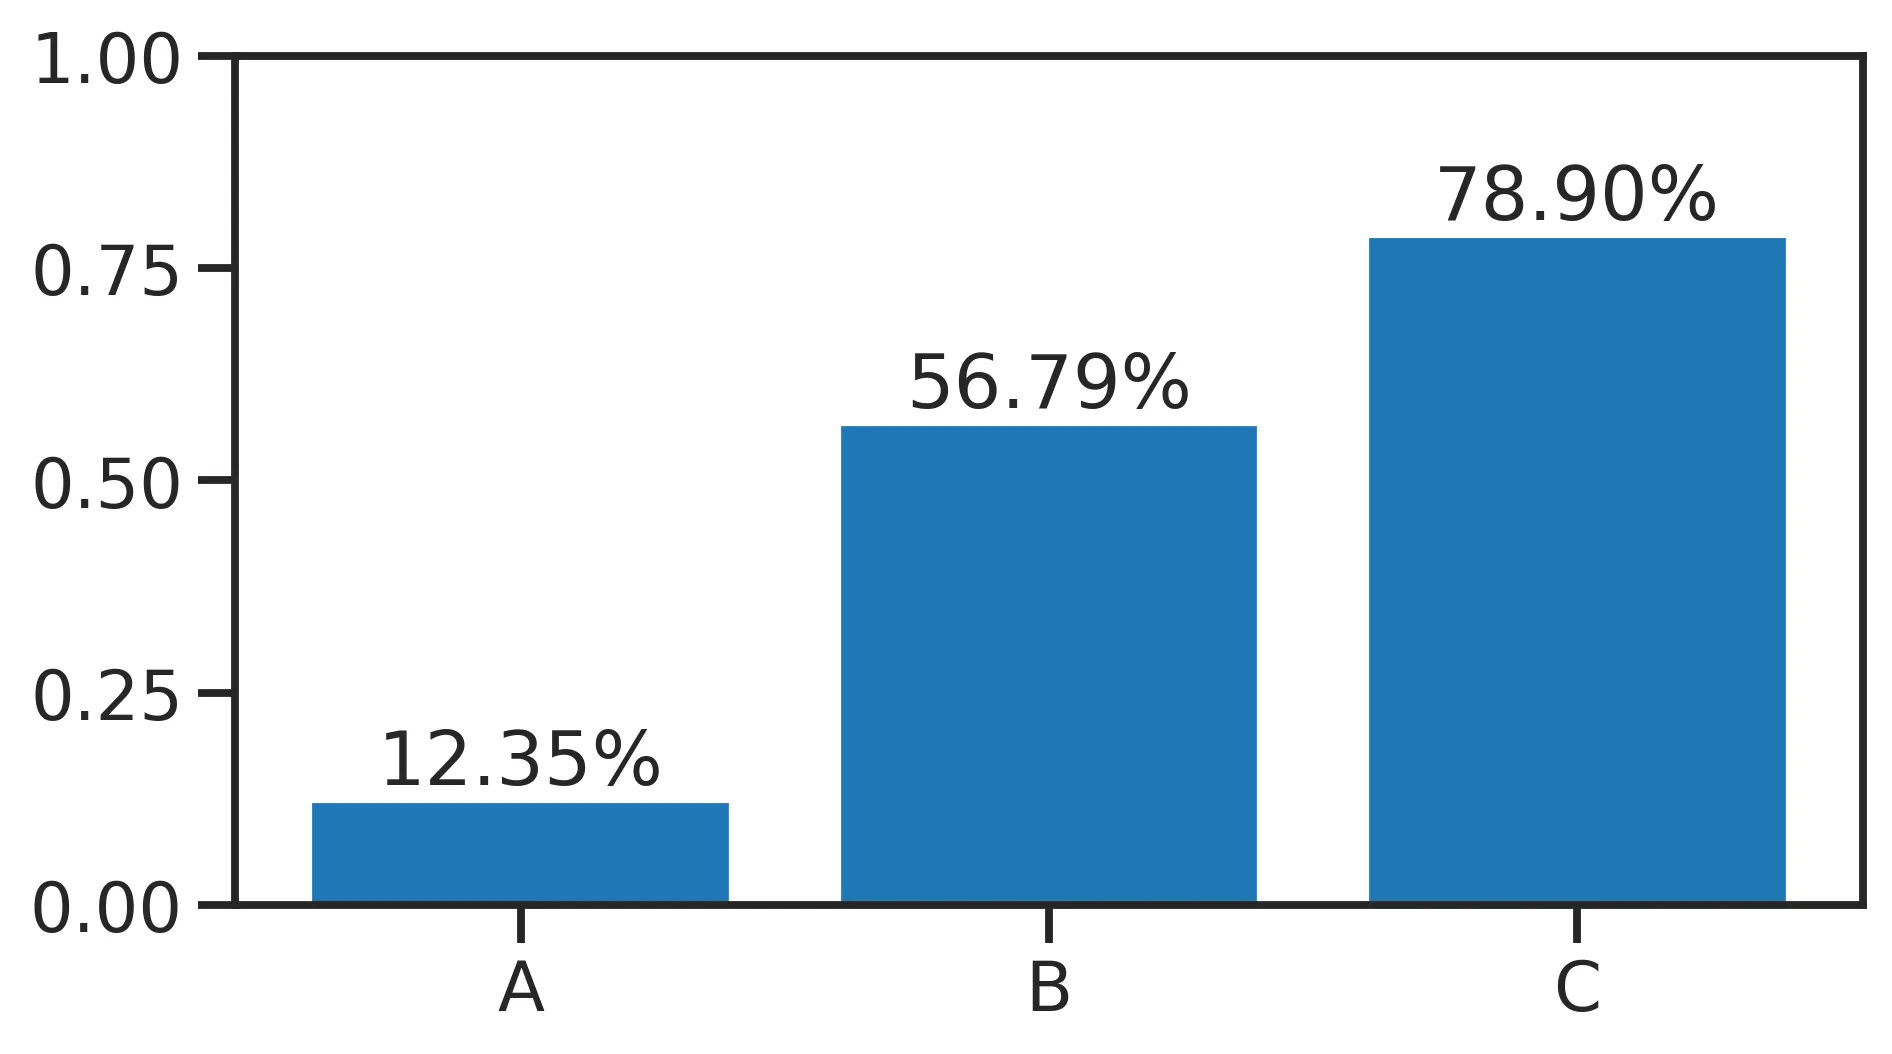
百分比标签
bars = plt.bar(list('ABC'), [0.123456, 0.567890, 0.789012])
plt.bar_label(bars, fmt='{:.2%}')
plt.bar_label(bars, labels=[f'{x:.2%}' for x in bars.datavalues])
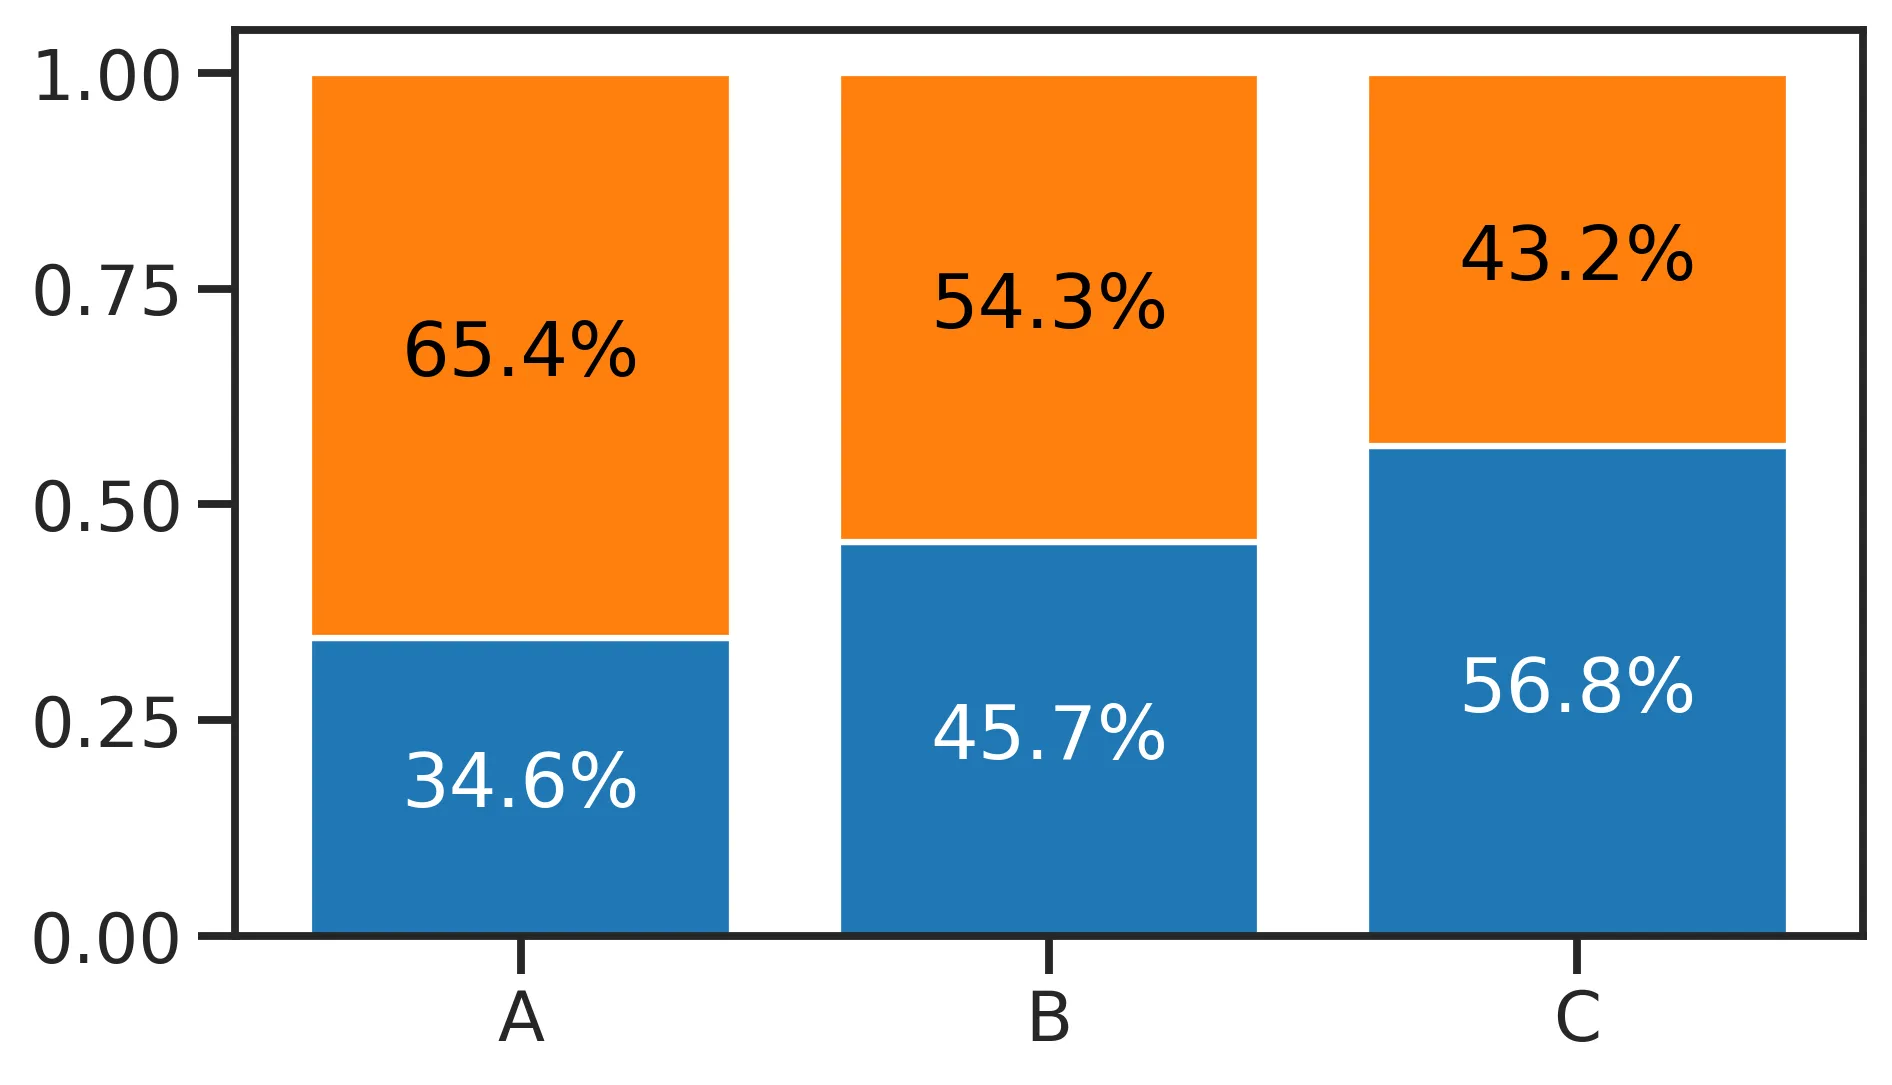
堆叠百分比标签
x = list('ABC')
y = [0.7654, 0.6543, 0.5432]
fig, ax = plt.subplots()
ax.bar(x, y)
ax.bar(x, 1 - np.array(y), bottom=y)
colors = list('wk')
for bars, color in zip(ax.containers, colors):
ax.bar_label(bars, fmt='{:.1%}', color=color, label_type='center')
for bars, color in zip(ax.containers, colors):
labels = [f'{x:.1%}' for x in bars.datavalues]
ax.bar_label(bars, labels=labels, color=color, label_type='center')
fmt现在支持{}样式的格式化字符串。 - tdy