在版本3.4中,matplotlib新增了自动柱形图标签功能:https://matplotlib.org/stable/users/whats_new.html#new-automatic-labeling-for-bar-charts
我正在尝试将其用于Seaborn生成的柱形图。
fig, axs = plt.subplots(
        nrows=2,
    )

for i, col in enumerate(['col_1', 'col_2']):
        ax = axs[i]
        sns.barplot(
            x="class",
            y=col,
            hue="hue_col",
            data=data_df,
            edgecolor=".3",
            linewidth=0.5,
            ax=ax
        )


        ax.bar_label(ax.containers[i]) # Doesn't work
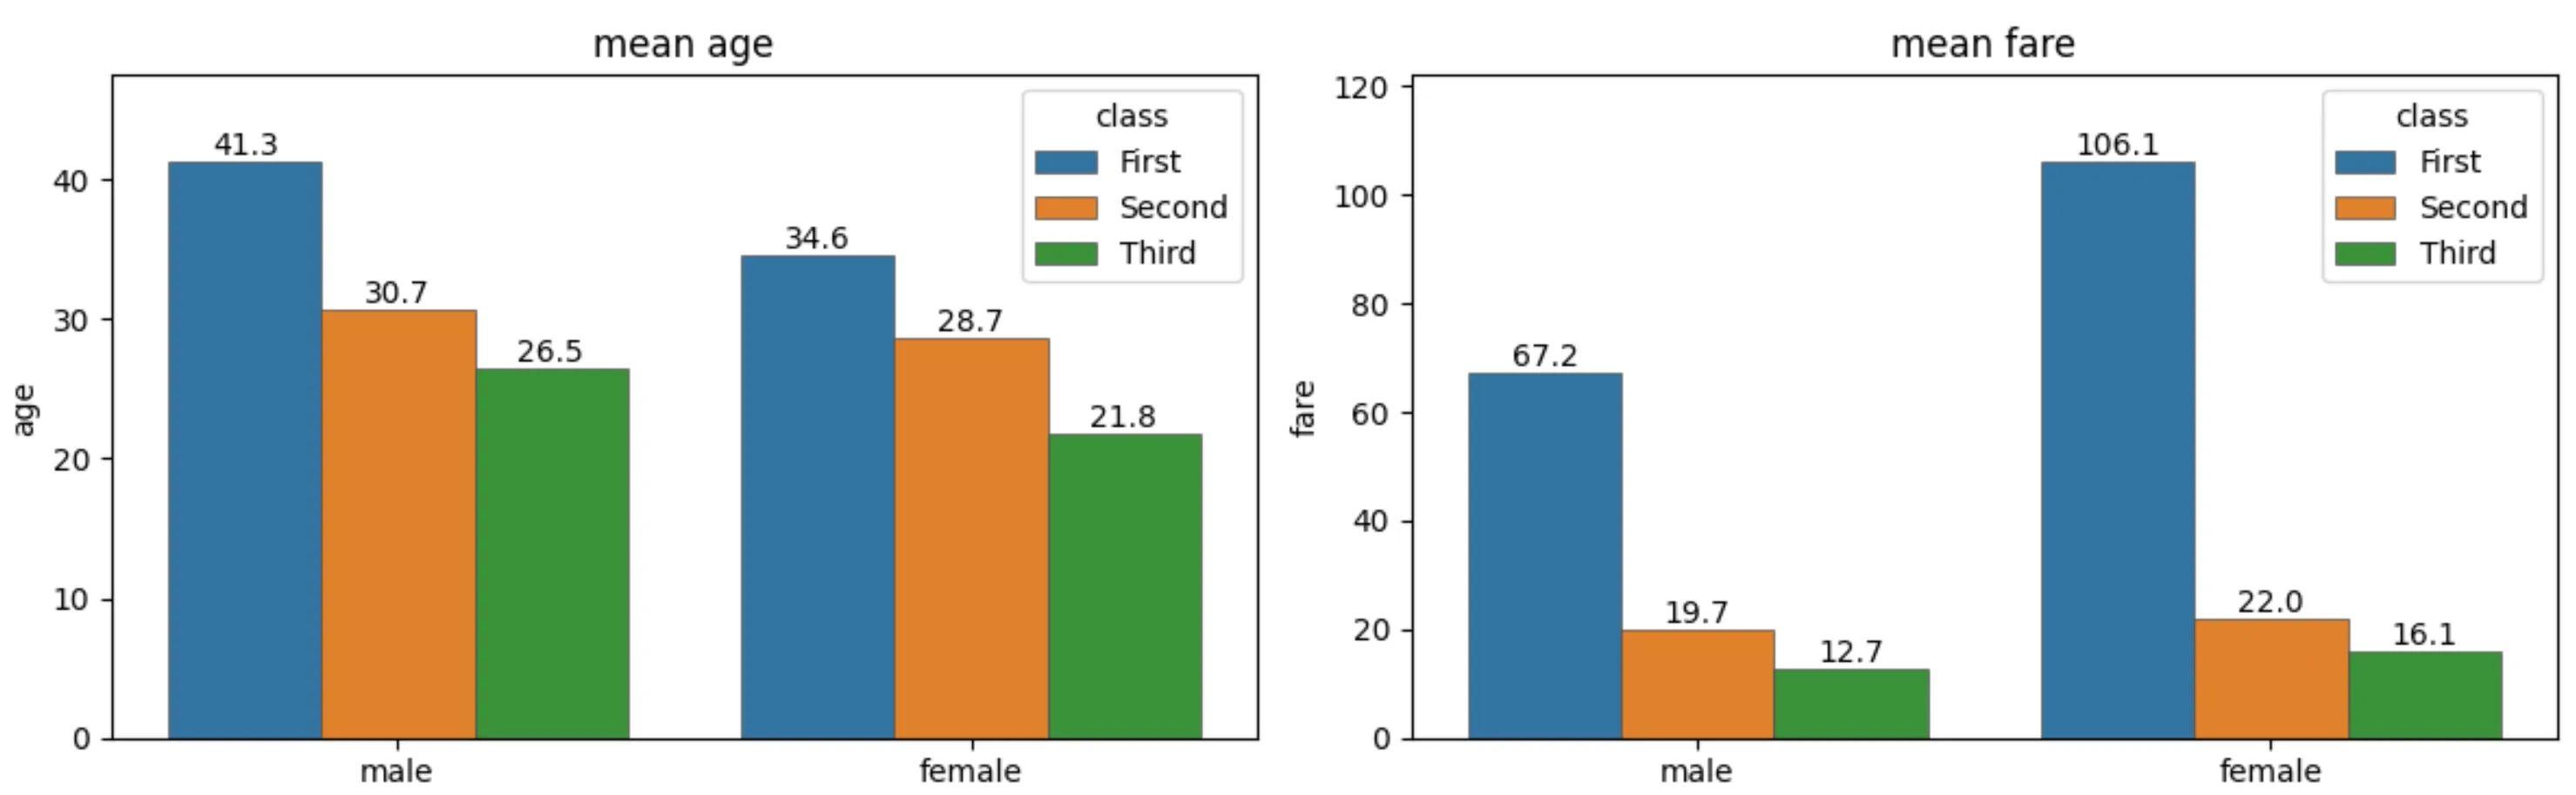
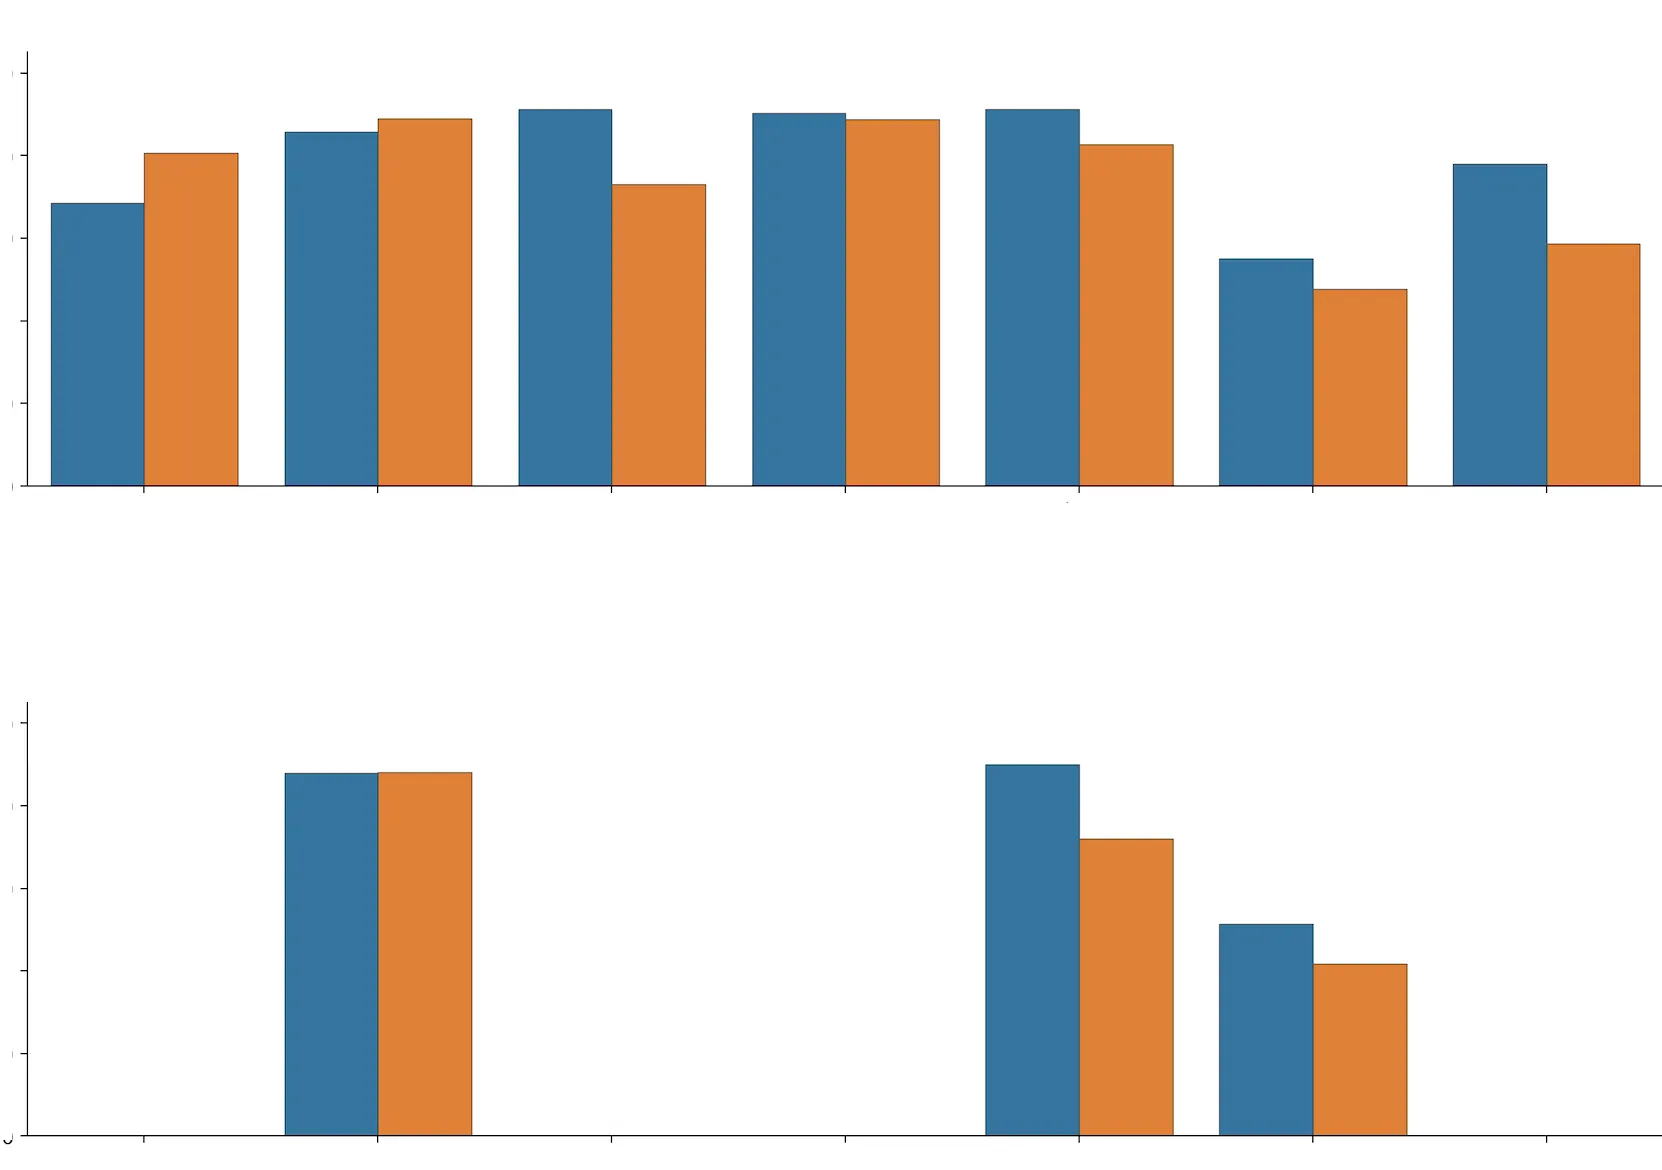
我需要做什么才能让这个工作?示例图