Seaborn中的堆叠条形图

13

我有以下数据:

countries2012 = [
    'Bolivia',
    'Brazil',
    'Sri Lanka',
    'Dominican Republic',
    'Indonesia',
    'Kenya',
    'Honduras',
    'Mozambique',
    'Peru',
    'Philipines',
    'India',
    'Vietnam',
    'Thailand',
    'USA',
    'World'
]

percentage2012 = [ 
    0.042780099,
    0.16599952,
    0.012373058,
    0.019171717,
    0.011868674,
    0.019239173,
    0.00000332,
    0.014455196,
    0.016006654,
    0.132970981,
    0.077940824,
    0.411752517,
    0.017986798,
    0.017361808,
    0.058076027
]

countries2013 = [
    'Bolivia',
    'Brazil',
    'Sri Lanka',
    'Dominican Republic', 
    'Indonesia', 
    'Honduras',
    'Mozambique', 
    'Peru', 
    'Philippines', 
    'India', 
    'Vietnam', 
    'Thailand', 
    'USA',
    'World'  
]

percentage2013 = [
    0.02736294,
    0.117160272, 
    0.015815952 ,
    0.018831589,
    0.020409103 ,
    0.00000000285,
    0.018876854,
    0.018998639,
    0.117221146,
    0.067991687,
    0.496110972,
    0.019309486,
    0.026880553,
    0.03503080414999993
]

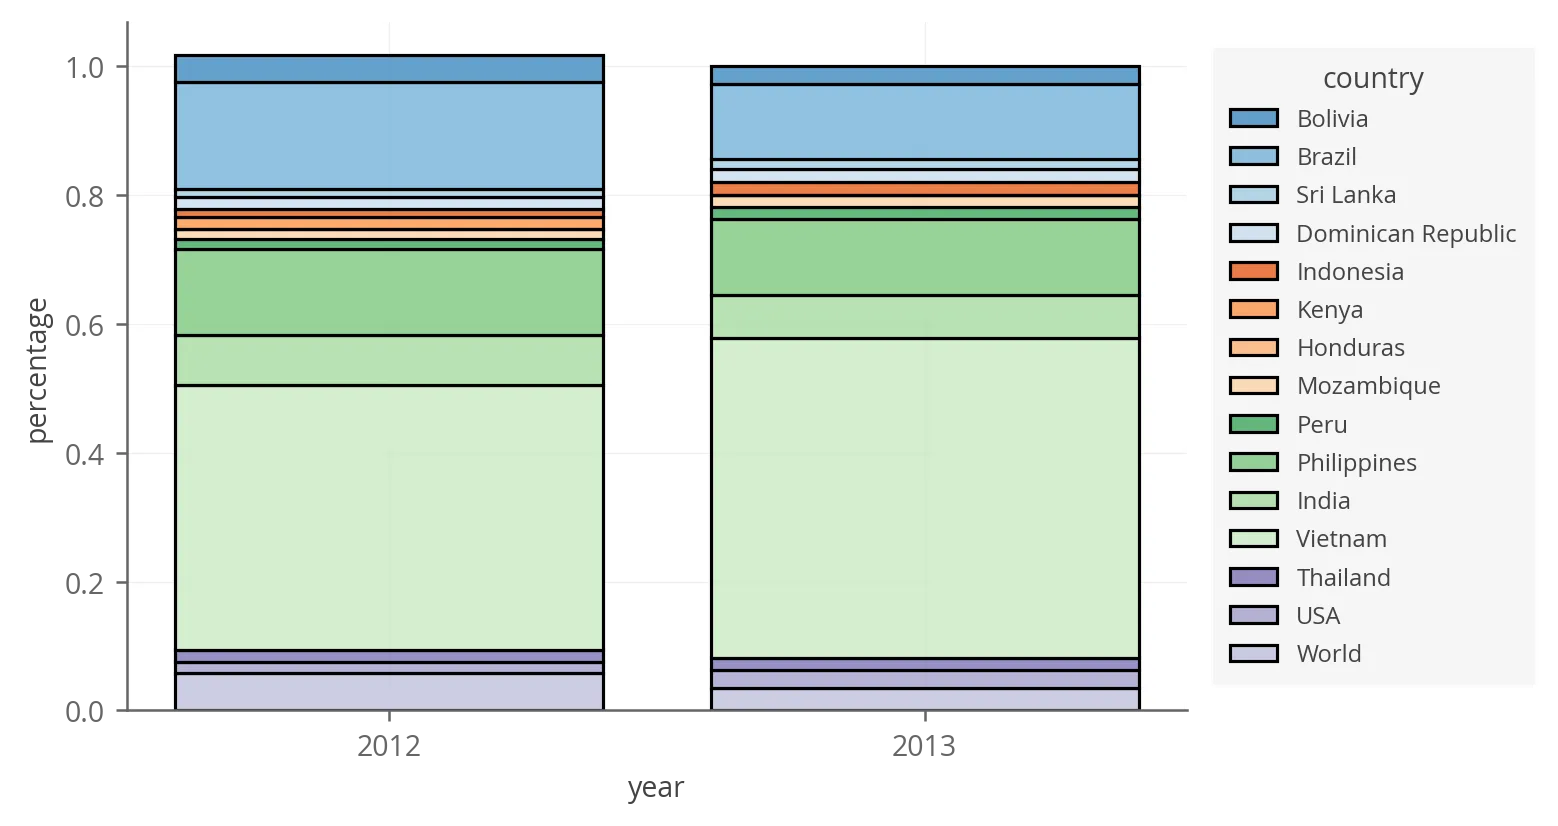
我想制作一张堆积条形图,其中有一个堆积条代表2012年,另一个代表2013年。

由于2012年和2013年的国家不同,我该如何操作?

2个回答

43

由于这个问题要求在 Seaborn 中使用堆叠条形图,并且被接受的答案使用了 pandas,我想给出一种实际使用 Seaborn 的替代方法。

Seaborn 给出了一个堆叠条形图的示例,但是它有点不可靠,需要绘制总和并在其上叠加条形。相反,您可以实际上使用直方图图和 weights 参数。

import pandas as pd
import seaborn as sns

# Put data in long format in a dataframe.
df = pd.DataFrame({
    'country': countries2012 + countries2013,
    'year': ['2012'] * len(countries2012) + ['2013'] * len(countries2013),
    'percentage': percentage2012 + percentage2013
})

# One liner to create a stacked bar chart.
ax = sns.histplot(df, x='year', hue='country', weights='percentage',
             multiple='stack', palette='tab20c', shrink=0.8)
ax.set_ylabel('percentage')
# Fix the legend so it's not on top of the bars.
legend = ax.get_legend()
legend.set_bbox_to_anchor((1, 1))

seaborn stacked bar chart


3

如果我理解正确,您可以创建一个Pandas数据帧并使用其绘图函数:

import pandas as pd
df = pd.concat([pd.DataFrame({2012:percentage2012}, index=countries2012),
                pd.DataFrame({2013:percentage2013}, index=countries2013)],
               axis=1, sort=False)

df.T.plot.bar(stacked=True, figsize=(12,6))

输出:

在此输入图片描述


有没有一种简单的方法可以使堆栈顺序相反(以便在图例和堆栈中从上到下以相同的顺序获取国家)? - JohanC
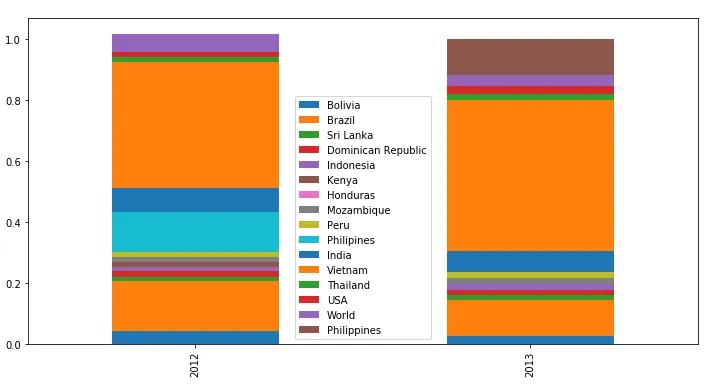
df.T.iloc[::-1].plot...? - Quang Hoang

网页内容由stack overflow 提供, 点击上面的
可以查看英文原文,
原文链接