使用Seaborn绘制带有阴影的堆叠条形图

4

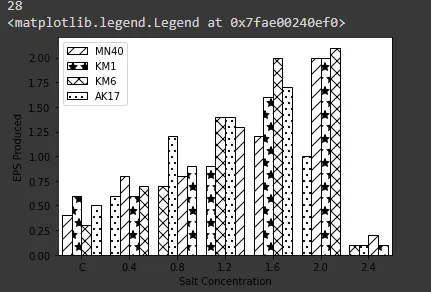
我正在尝试使用seaborn/matplotlib进行阴影堆积条形图的绘制,但是阴影效果不正确,如下图所示:

enter image description here

我的代码如下:

 sc_bar=sns.barplot(x='Salt Concentration',y='EPS 
             Produced',data=df_salt_conc_mod,hue='Strain',fill=False,edgecolor='black')
 bars = sc_bar.patches
 pattern=['//','..','xx','*']
 hatches=np.tile(pattern,7)

i=0

for bar in bars:
bar.set_hatch(pattern[i])
i+=1
count+=1
if(i>3):
    i=0

sc_bar.legend()

我做错了什么?

1个回答

2

我们来试试 zip

df = sns.load_dataset('tips')
sc_bar = sns.barplot(data=df, x='tip', y='sex', hue='day', fill=False)
bars = sc_bar.patches
pattern=['//','..','xx','*']

# replace 2 with 7 in your code
hatches=np.repeat(pattern,2)

for pat,bar in zip(hatches,bars):
    bar.set_hatch(pat)

sc_bar.legend()

输出:

enter image description here


网页内容由stack overflow 提供, 点击上面的
可以查看英文原文,
原文链接