我在尝试运行这个非常简单的示例时遇到了问题:
from numpy import datetime64
from pandas import Series
import matplotlib.pyplot as plt
import datetime

x = Series ([datetime64("2016-01-01"),datetime64("2016-02-01")]).astype(datetime)
y = Series ([0.1 , 0.2])

ax = plt.subplot(111)
ax.bar(x, y, width=10)
ax.xaxis_date()

plt.show()
我收到的错误信息是:
TypeError: float() argument must be a string or a number, not 'Timestamp'
请注意
astype(datetime)这一部分——这是我在阅读了另一个SO帖子后尝试的。如果没有这个部分,我会得到相同的错误。另一方面,这个示例对于普通的
datetime64类型也可以很好地工作——也就是说,更改这两行:x = [datetime64("2016-01-01"),datetime64("2016-02-01")]
y = [0.1 , 0.2]
因此,问题必须是pandas将
datetime64对象转换为的Timestamp类型。有没有一种方法可以直接使用Timestamp使其工作,而不是恢复到datetime64?我在这里使用Series/Timestamp,因为我的真正目标是从DataFrame绘制系列。(注意:我不能使用DataFrame绘图方法,因为我的真实示例在seaborn FacetGrid中,我必须直接使用matplotlib。)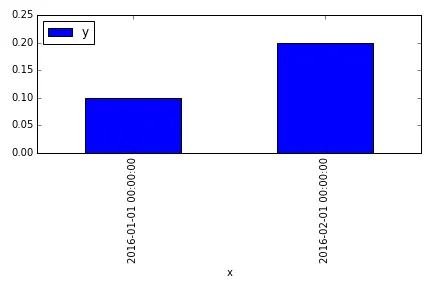
FacetGrid中工作,需要直接使用matplotlib。 - sparc_spread