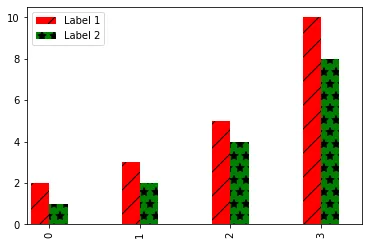
我该如何为我的数据应用不同的填充图案,就像我可以定义不同的颜色元组一样?
#!/usr/bin/env python3
import pandas
from matplotlib import pyplot as plt

data = {"Label 1": [2,3,5,10], "Label 2": [1,2,4,8]}
pandas.DataFrame(data).plot.bar(color=("grey", "white"), hatch=("/", "*"))
plt.show()
使用这段代码,Hatches将应用于所有条形图。
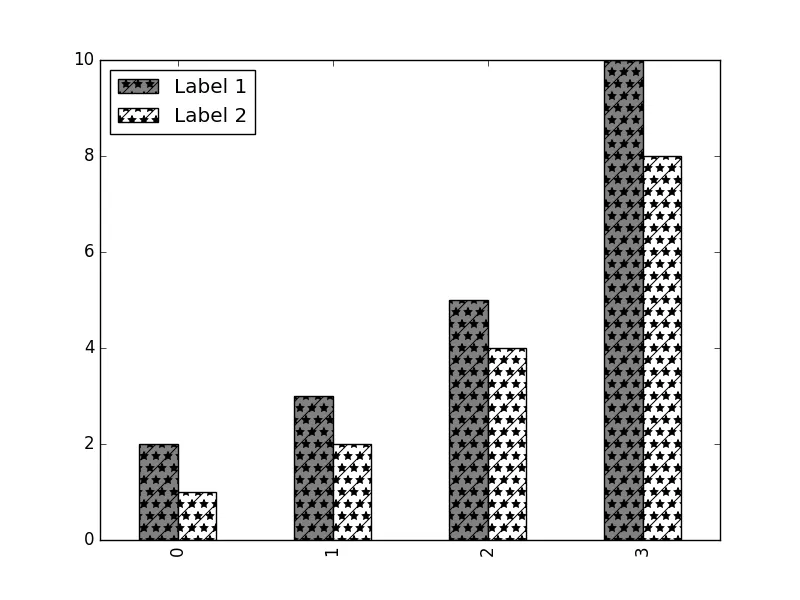
Hatches将同时应用于所有条形图。相反,我更希望每个数据集都使用自己的hatch-color组合。
我知道我可以像这样手动修改绘图中的每个patch:
ax = pandas.DataFrame(data).plot.bar(color=("grey", "white"), legend=False)
for container, hatch in zip(ax.containers, ("/", "*")):
    for patch in container.patches:
        patch.set_hatch(hatch)
ax.legend(loc='upper center')
plt.show()
手动设置填充图案:
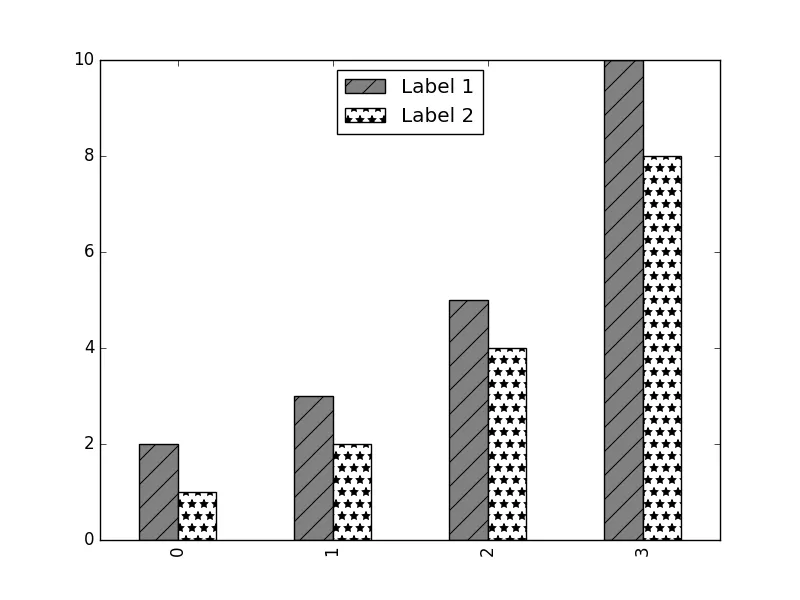
这有点取巧,但是我通过这个讨论找到了最好的解决方案。
在组合图中应用不同数据集的填充图案的正确方法是什么?