我该如何在我的条形图中添加渐变
facecolor?我想知道如何使用单色渐变到复杂的多色渐变。以下是一些示例代码:import numpy as np
import matplotlib.pyplot as plt
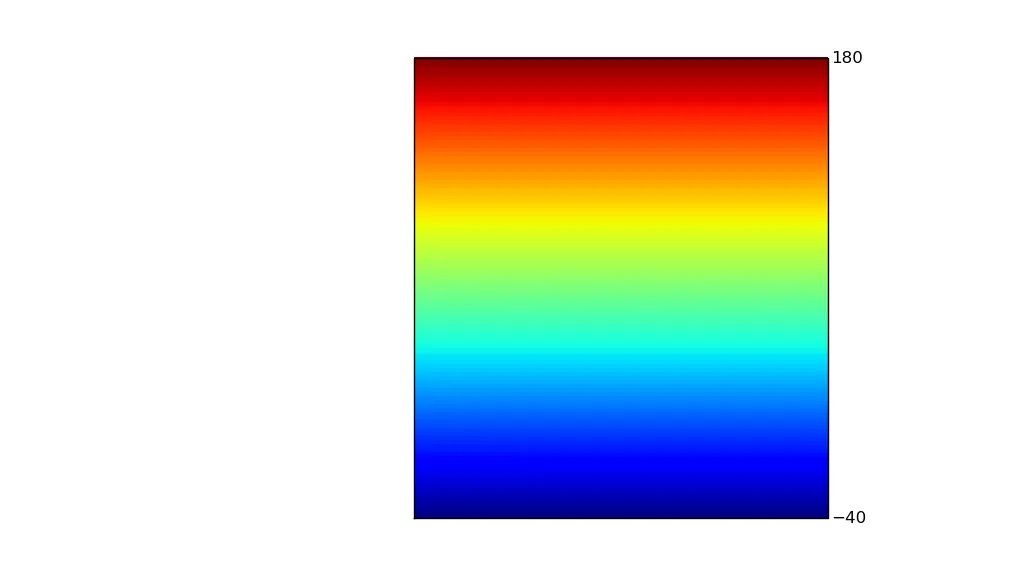
plt.figure(figsize=(1,5))
plt.axis([0,1,-50,200])
plt.xticks([])
plt.yticks([-40,180])
plt.bar(left=0, width=1, bottom=-40, height=220, color='r')
plt.subplots_adjust(left=0.4, right=0.8)
plt.savefig("test.png")