通过直方图,有一个简单内置的选项histtype='step'。我如何以相同的风格制作条形图?
matplotlib中的未填充条形图
18
- Tristan Klassen
3
plt.bar(x, y, color="None") 是你想要的吗? - gcalmettes
不行,因为我想消除相邻条形之间的垂直线。 - Tristan Klassen
1我在这里找到了答案。实际上,这正是我想做的事情(将条形图用作直方图),但我没有找到它,因为我一直在寻找与条形图有关的问题。 - Tristan Klassen
3个回答
17
将条形图的可选关键字设置为
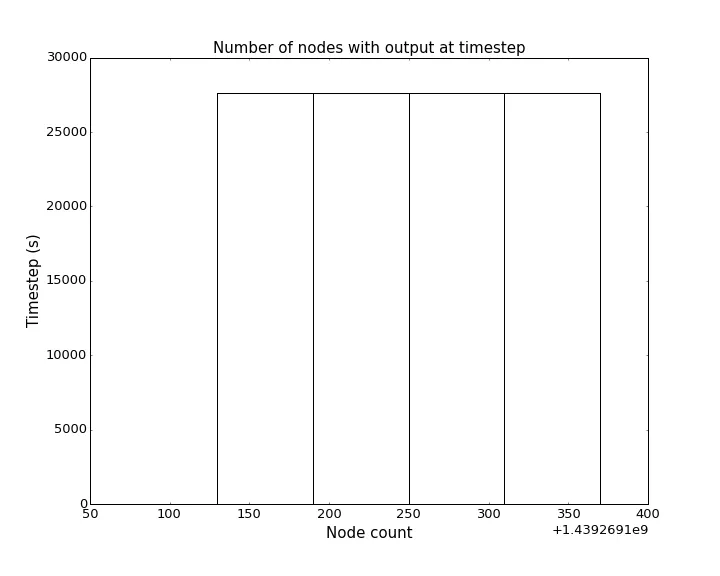
fill=False:import matplotlib.pyplot as plt
plt.bar(bins[:5], counts[:5], fill=False, width=60) # <- this is the line
plt.title("Number of nodes with output at timestep")
plt.xlabel("Node count")
plt.ylabel("Timestep (s)")
将会给出:
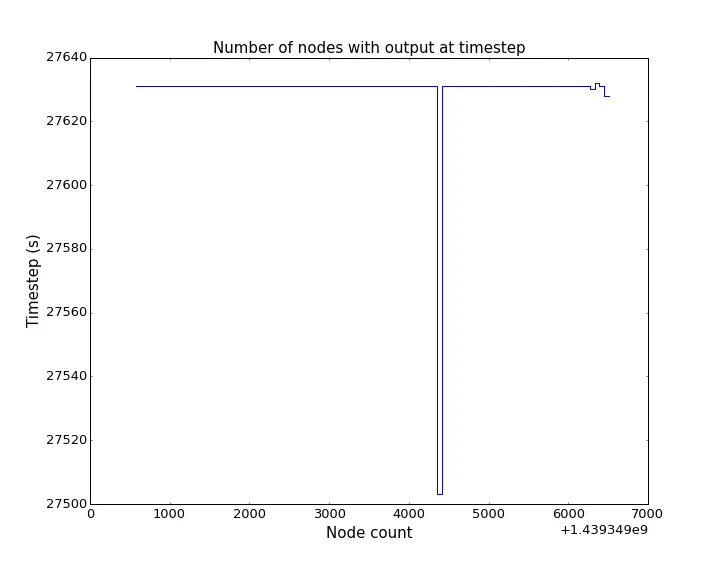
或者使用关键字ls='steps'的plt.plot:
plt.plot(bins[-100:], counts[-100:], ls='steps')
plt.title("Number of nodes with output at timestep")
plt.xlabel("Node count")
plt.ylabel("Timestep (s)")
- XValidated
2
第二张图正是我认为他想要的,也是我在寻找的。 - jimh
谢谢你的回答!但是我们能否避免条形图的内边缘呢?比如说,在x=250处的垂直线? - Xu Shan
10
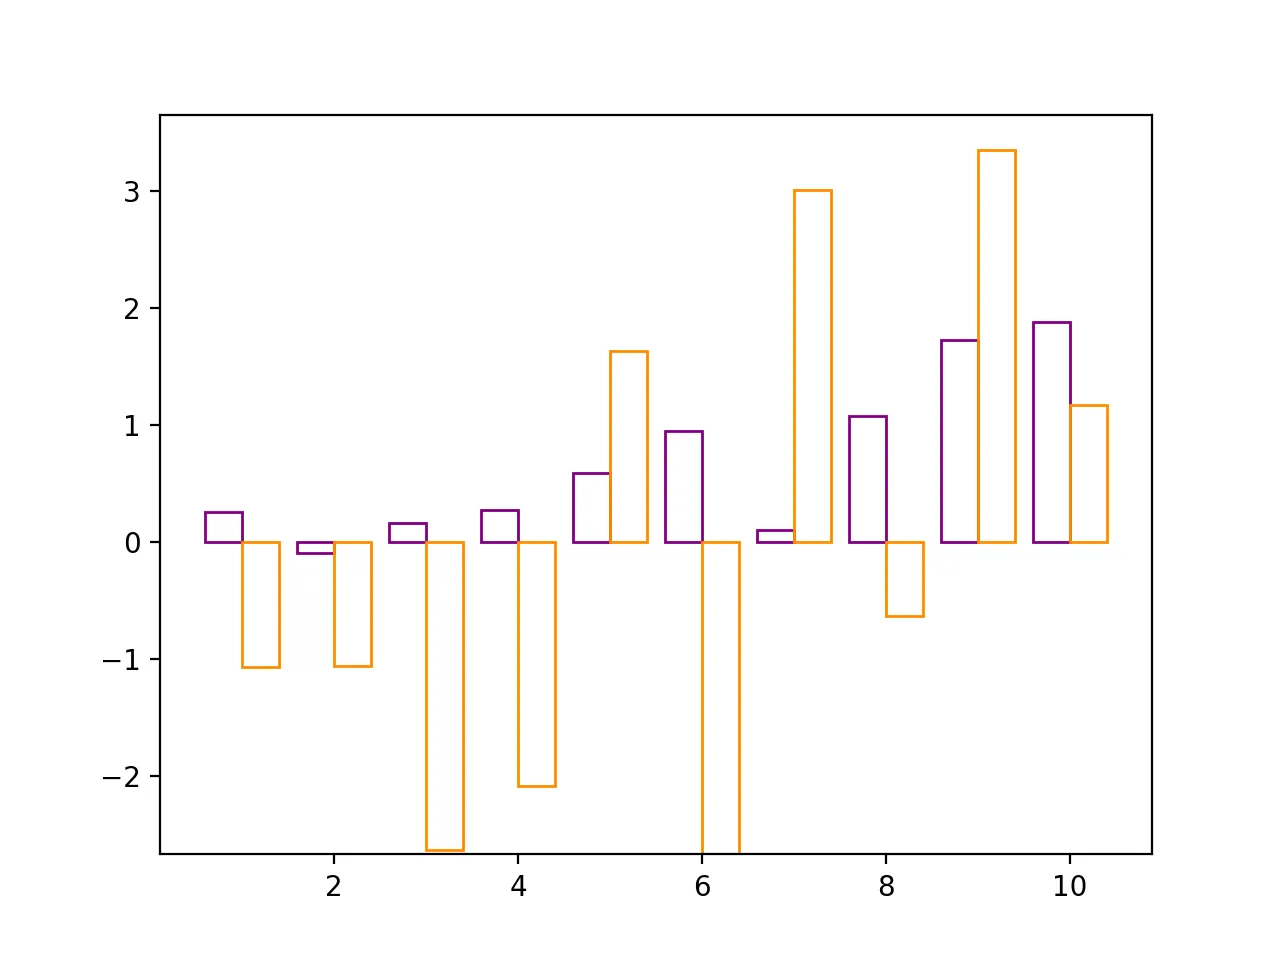
虽然OP提供了一个回答直方图步骤图的略微不同的问题的帖子,但是这里有一个解决方案适用于任何经过这里的人,他们特别想关闭pyplot.bar的柱形图中的面颜色:
import matplotlib.pyplot as plt
import numpy as np

# create x coords for the bar plot
x = np.linspace(1, 10, 10)

# cook up some random bar heights -- exact results may vary :-P
y = np.random.randn(10)
z = np.random.randn(10) * 2

# plot bars with face color off
plt.bar(x-0.2, y, width=0.4, edgecolor='purple', color='None')
plt.bar(x+0.2, z, width=0.4, edgecolor='darkorange', color='None')
plt.show()
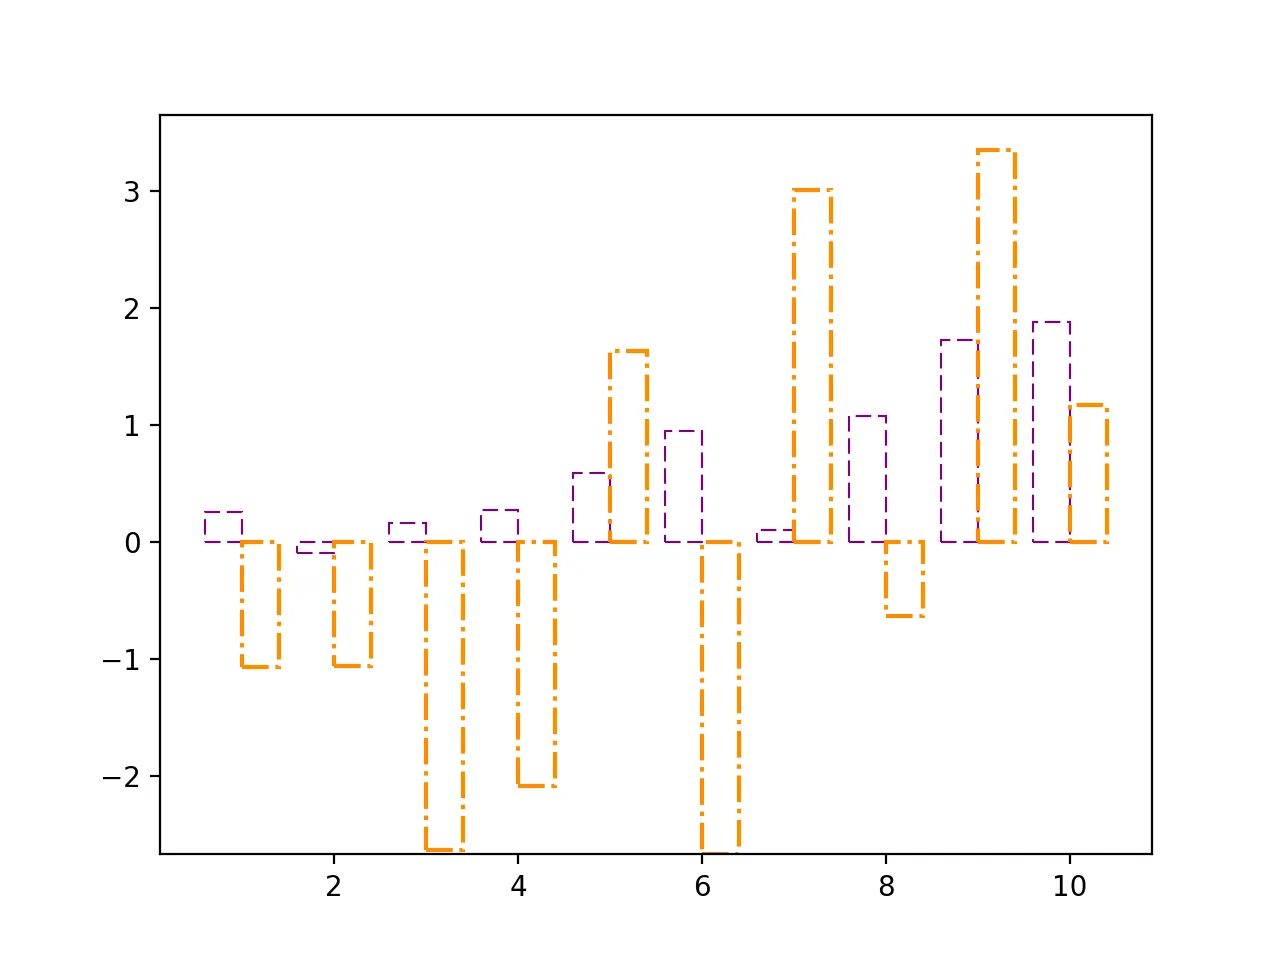
matplotlib.lines.Line2D属性,例如linewidth、linestyle、alpha等。plt.bar(x-0.2, y, width=0.4, edgecolor='purple', color='None',
linewidth=0.75, linestyle='--')
plt.bar(x+0.2, z, width=0.4, edgecolor='darkorange', color='None',
linewidth=1.5, linestyle='-.')
plt.show()
- isosceleswheel
网页内容由stack overflow 提供, 点击上面的可以查看英文原文,
原文链接
原文链接