Matplotlib中从右到左的水平条形图

5

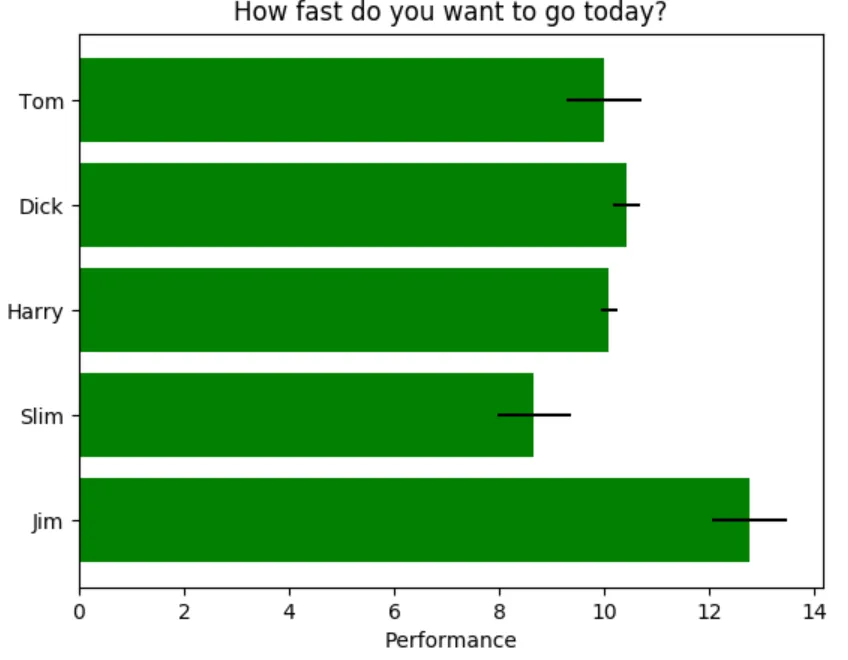
这里提供的示例代码在这里生成了这个图表:

enter image description here

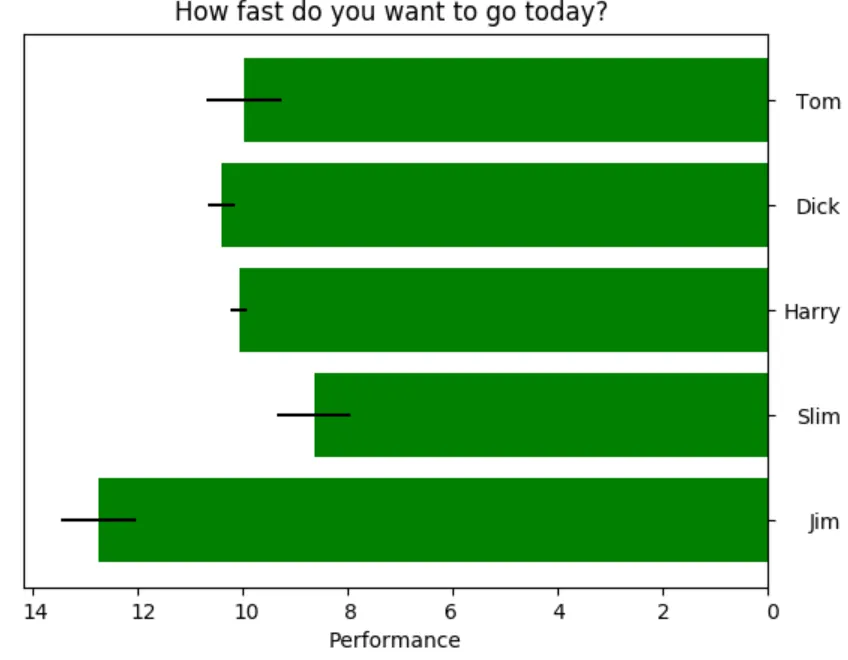
我想知道是否可以绘制完全相同但“镜像”的图形,就像这样:

enter image description here

如果链接失效,这里提供了示例代码:

import matplotlib.pyplot as plt
import numpy as np

# Fixing random state for reproducibility
np.random.seed(19680801)


plt.rcdefaults()
fig, ax = plt.subplots()

# Example data
people = ('Tom', 'Dick', 'Harry', 'Slim', 'Jim')
y_pos = np.arange(len(people))
performance = 3 + 10 * np.random.rand(len(people))
error = np.random.rand(len(people))

ax.barh(y_pos, performance, xerr=error, align='center',
        color='green', ecolor='black')
ax.set_yticks(y_pos)
ax.set_yticklabels(people)
ax.invert_yaxis()  # labels read top-to-bottom
ax.set_xlabel('Performance')
ax.set_title('How fast do you want to go today?')

plt.show()

一个技巧是绘制-
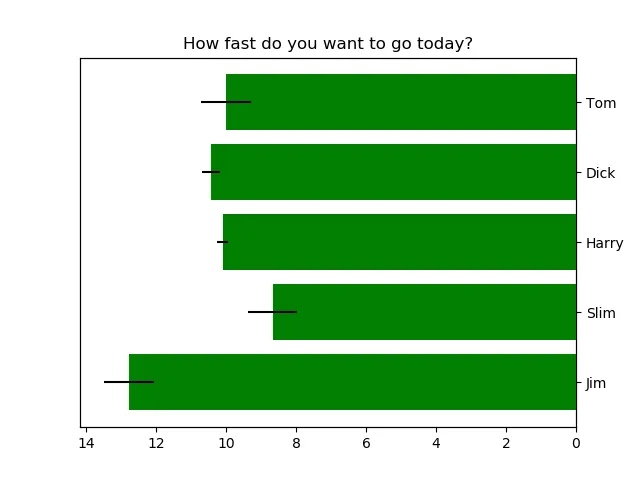
performance图,并将xticks更改为正数。 - Lucas
2个回答

5
你离正确答案很近了,但是忘记了加上 ax.invert_xaxis()。不过,你已经把 y 轴的刻度线放在了左侧。
要将刻度线放在右侧,你需要先创建一个双重 x 轴(即右侧 y 轴)实例(这里用 ax1),然后在其上绘制条形图。你可以通过传递 [] 来隐藏左侧 y 轴的刻度线和标签。
我提供两种解决方法(代码的其余部分保持不变,只需现在使用 ax1 替换 ax)。 解决方案 1
ax.set_yticklabels([]) # Hide the left y-axis tick-labels
ax.set_yticks([]) # Hide the left y-axis ticks
ax1 = ax.twinx() # Create a twin x-axis
ax1.barh(y_pos, performance, xerr=error, align='center',
    color='green', ecolor='black') # Plot using `ax1` instead of `ax`
ax1.set_yticks(y_pos)
ax1.set_yticklabels(people)

解决方案2(相同输出):保持图表在左轴上(ax),反转x轴,然后在ax1上设置y刻度标签。

ax.invert_yaxis()  # labels read top-to-bottom
ax.invert_xaxis()  # labels read top-to-bottom

ax2 = ax.twinx()
ax2.set_ylim(ax.get_ylim())
ax2.set_yticks(y_pos)
ax2.set_yticklabels(people)

enter image description here


2
另一种方法是在x轴上简单地设置反向限制,就像这样:
ax.set_xlim(14,0)

网页内容由stack overflow 提供, 点击上面的
可以查看英文原文,
原文链接