如何在使用matplotlib绘制直方图时画一条平均线(水平)?
目前,我能够毫无问题地绘制出直方图。这是我正在使用的代码:
## necessary variables
ind = np.arange(N)                # the x locations for the groups
width = 0.2                      # the width of the bars
plt.tick_params(axis='both', which='major', labelsize=30)
plt.tick_params(axis='both', which='minor', labelsize=30)
ax2 = ax.twinx()
## the bars

rects1 = ax.bar(ind, PAAE1, width,
            color='0.2',
            error_kw=dict(elinewidth=2,ecolor='red'),
            label='PAAE1')

rects2 = ax.bar(ind+width, PAAE2, width,
                color='0.3',
                error_kw=dict(elinewidth=2,ecolor='black'),
                label='PAAE2')

rects3 = ax2.bar(ind+width+width, AAE1, width,
            color='0.4',
            error_kw=dict(elinewidth=2,ecolor='red'),
            label='AAE1')

rects4 = ax2.bar(ind+3*width, AAE2, width,
                color='0.5',
                error_kw=dict(elinewidth=2,ecolor='black'),
                       label='AAE3')


maxi = max(dataset[2])
maxi1 = max(dataset[4])
f_max = max(maxi, maxi1)
lns = [rects1,rects2,rects3,rects4]
labs = [l.get_label() for l in lns]


ax.legend(lns, labs, loc='upper center', ncol=4)

# axes and labels
ax.set_xlim(-width,len(ind)+width)
ax.set_ylim(0, 100)
ax.set_ylabel('PAAE', fontsize=25)
ax2.set_ylim(0, f_max+500)
ax2.set_ylabel('AAE (mW)', fontsize=25)
xTickMarks = dataset[0]
ax.set_xticks(ind+width)
xtickNames = ax.set_xticklabels(xTickMarks)
plt.setp(xtickNames, rotation=90, fontsize=25)
我想为PAAE 1、2和AAE 1、2绘制平均线。我应该使用什么来绘制平均线?
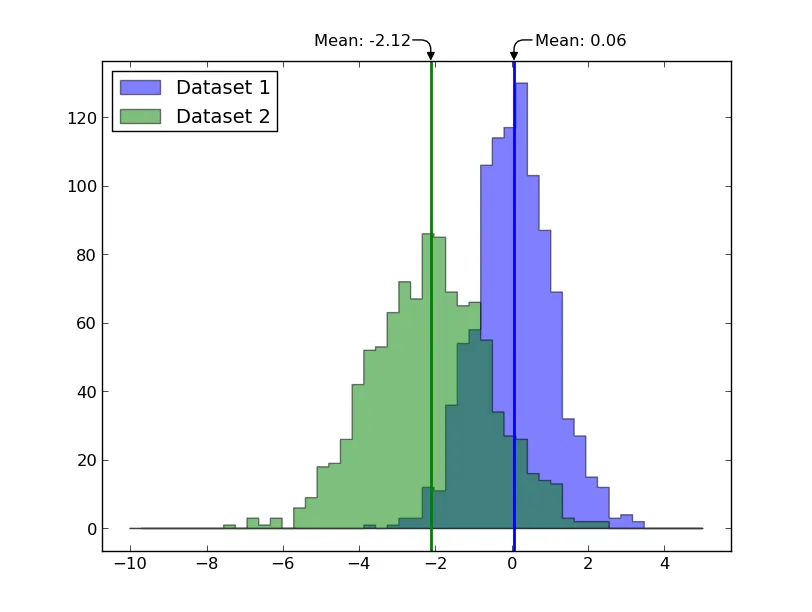
y值处绘制几条水平线吗? - elyase