将适合的对数正态分布概率密度函数在Python中缩放到直方图上。

3

我有一组服从对数正态分布的样本,并想对其进行拟合。然后我想将样本的直方图和拟合后的概率密度函数绘制在同一个图中,而且我想使用直方图的原始比例尺。

我的问题是:如何直接缩放概率密度函数,使其在直方图中可见?

以下是代码:

import numpy as np
import scipy.stats

# generate log-normal distributed set of samples
samples   = np.random.lognormal( mean=1., sigma=.4, size=10000 )

# make a fit to the samples and generate the resulting PDF
shape, loc, scale = scipy.stats.lognorm.fit( samples, floc=0 )
x_fit       = np.linspace( samples.min(), samples.max(), 100 )
samples_fit = scipy.stats.lognorm.pdf( x_fit, shape, loc=loc, scale=scale )
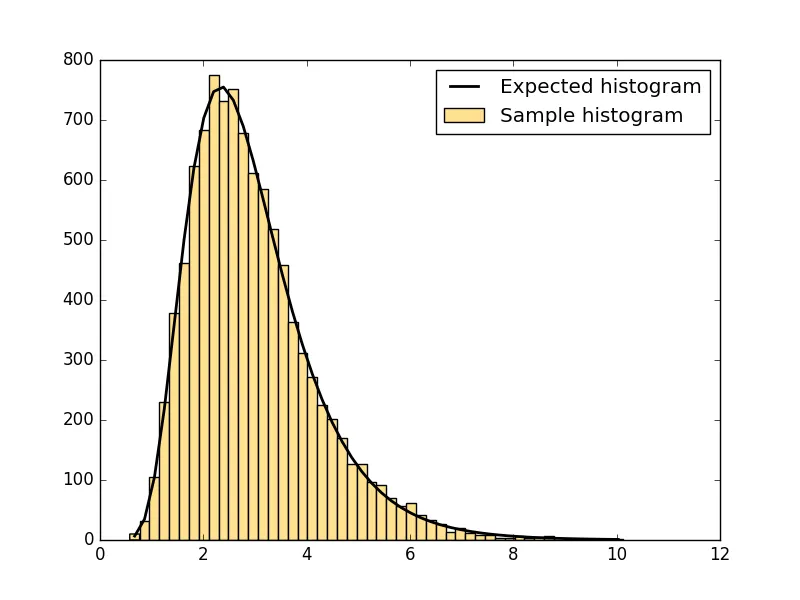
为了更好地理解我的意思,这里有一张图: 左:样本。中间:直方图和拟合的PDF。右:归一化的直方图和拟合的PDF

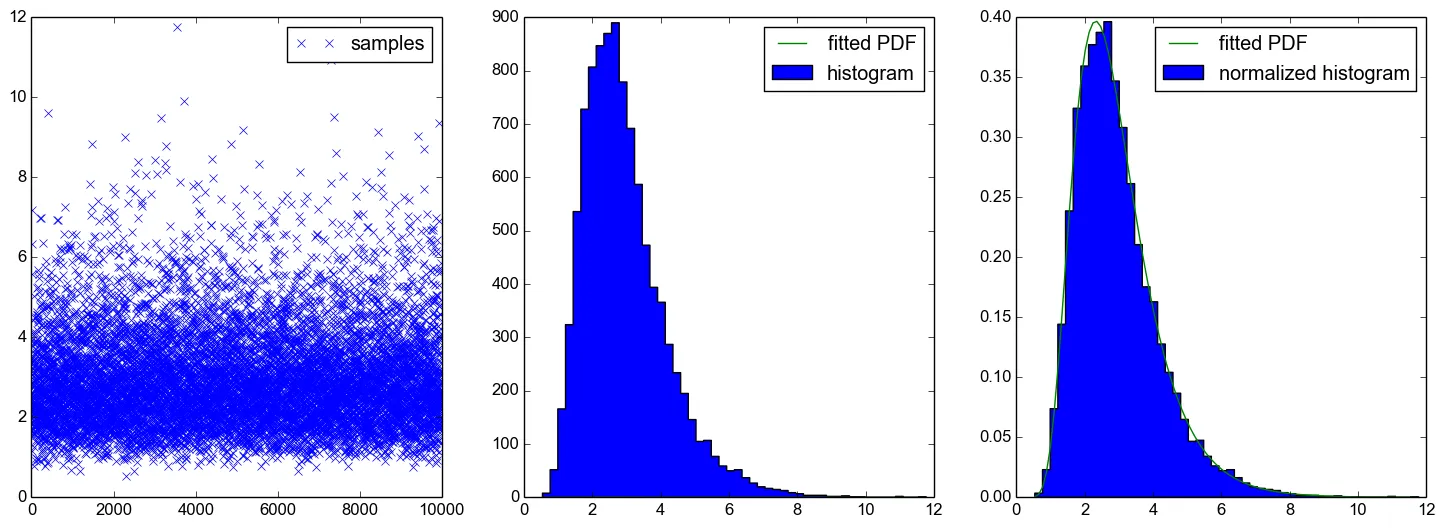
我的问题是,是否有一个参数可以轻松地将PDF缩放到直方图上(我还没有找到这个参数,但这并不意味着太多......),以使PDF在中间的图中可见?

1个回答

6
您所要求的是期望直方图的绘制。
假设 [a, b] 是直方图的一个 x 区间。对于大小为 n 的随机样本,区间内样本数量的期望值为:
(cdf(b) - cdf(a))*n

cdf(x)是累积分布函数。要绘制预期的直方图,您需要计算每个箱的值。

下面的脚本展示了在matplotlib直方图上绘制预期直方图的一种方法。它生成了这个图表:

直方图

import numpy as np
import scipy.stats
import matplotlib.pyplot as plt


# Generate log-normal distributed set of samples
np.random.seed(1234)
samples = np.random.lognormal(mean=1., sigma=.4, size=10000)

# Make a fit to the samples.
shape, loc, scale = scipy.stats.lognorm.fit(samples, floc=0)

# Create the histogram plot using matplotlib.  The first two values in
# the tuple returned by hist are the number of samples in each bin and
# the values of the histogram's bin edges.  counts has length num_bins,
# and edges has length num_bins + 1.
num_bins = 50
clr = '#FFE090'
counts, edges, patches = plt.hist(samples, bins=num_bins, color=clr, label='Sample histogram')

# Create an array of length num_bins containing the center of each bin.
centers = 0.5*(edges[:-1] + edges[1:])

# Compute the CDF at the edges. Then prob, the array of differences,
# is the probability of a sample being in the corresponding bin.
cdf = scipy.stats.lognorm.cdf(edges, shape, loc=loc, scale=scale)
prob = np.diff(cdf)

plt.plot(centers, samples.size*prob, 'k-', linewidth=2, label='Expected histogram')

# prob can also be approximated using the PDF at the centers multiplied
# by the width of the bin:
# p = scipy.stats.lognorm.pdf(centers, shape, loc=loc, scale=scale)
# prob = p*(edges[1] - edges[0])
# plt.plot(centers, samples.size*prob, 'r')

plt.legend()

plt.show()

注意:由于PDF是CDF的导数,因此您可以将cdf(b)- cdf(a)的近似值写为
cdf(b) - cdf(a) = pdf(m)*(b - a)

假设m是[a,b]区间的中点。那么对于您所问的确切问题的答案是通过将概率密度函数与样本大小和直方图箱宽相乘来进行比例缩放。脚本中有一些注释掉的代码,显示了如何使用缩放的概率密度函数绘制期望的直方图。但由于对数正态分布的累积分布函数也可用,因此也可以使用它。


虽然我知道将PDF的区域缩放到直方图,但我不知道CDF,非常感谢! - Alf

网页内容由stack overflow 提供, 点击上面的
可以查看英文原文,
原文链接