给定一个值的数组,我想通过它们的计数绘制一个对数直方图。我只知道如何对x轴值取对数,但是y轴的值因为它们在我的程序中没有被明确创建所以不知道该怎么做。
2个回答
28
请查看pyplot 文档。
- 使用关键字参数log=True,pyplot.hist可以为您记录y轴上的对数。
- pyplot.hist接受
bins关键字参数,但是您必须自己记录x轴上的对数。
例如:
#!/usr/bin/python
import numpy
from matplotlib import pyplot as plt

data = numpy.random.gumbel(2 ** 20, 2 ** 19, (1000, ))

bins = range(15, 25)
plt.xticks(bins, ["2^%s" % i for i in bins])
plt.hist(numpy.log2(data), log=True, bins=bins)
plt.show()
这将为您提供实际计数,显示每个箱子中有多少元素,并在对数轴上绘制(这通常是人们所指的对数图)。从您的措辞中我无法确定您是否希望在线性轴上绘制此数据的对数计数。
顺便说一下,箱子甚至不必间隔均匀。
- user670416
1
2将线性轴的计数的对数绘制出来相对容易,而且两种方法都会得到相同的图形。关键是要开始。但我不明白你在代码中做了什么:你是在真正的线性x比例尺上显示虚假的指数刻度标记吗? - Nikana Reklawyks
0
基于这个解决方案,我们可以定义这个简单的方法:
import numpy as np
import matplotlib.pyplot as plt

def plot_loghist(x, bins):
  hist, bins = np.histogram(x, bins=bins)
  logbins = np.logspace(np.log10(bins[0]),np.log10(bins[-1]),len(bins))
  plt.hist(x, bins=logbins)
  plt.xscale('log')
  plt.yscale('log')
然后像这样调用:
plot_loghist(data, 10)
这是我的数据输出示例: {{link1:
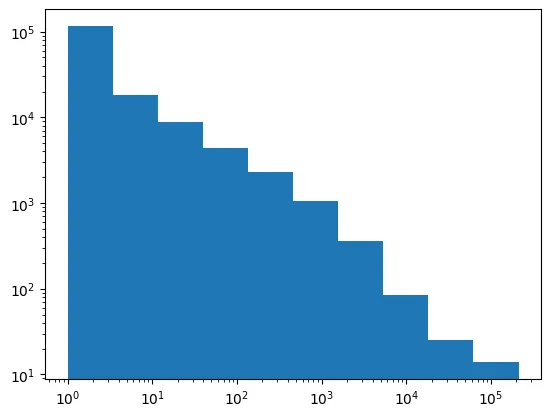 }}
}}- Alireza Mazochi
网页内容由stack overflow 提供, 点击上面的可以查看英文原文,
原文链接
原文链接