(在深入阅读源代码之前,请务必查看本文末尾的编辑部分)
我正在绘制一个人口的直方图,它似乎是对数拉普拉斯分布:
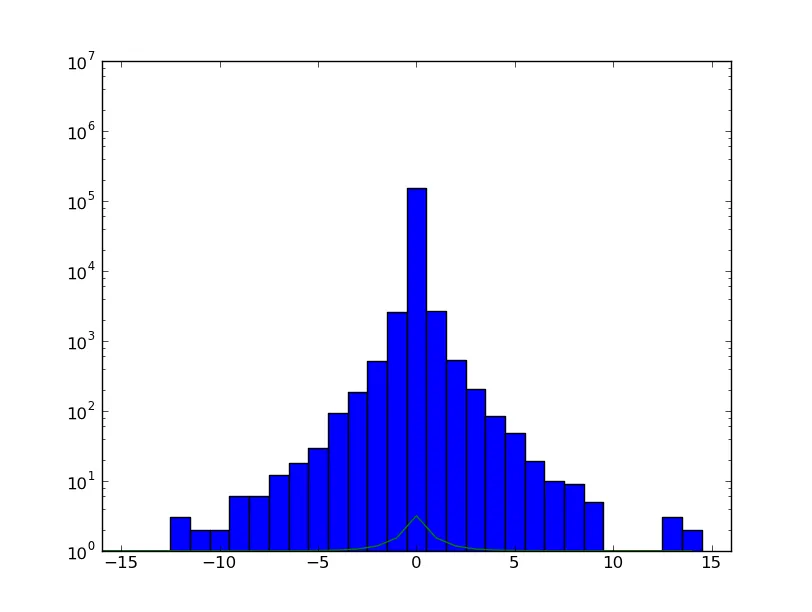
我试图画出最佳拟合线来验证我的假设,但我无法得到有意义的结果。
我使用维基百科上的拉普拉斯概率密度函数定义,并取10的PDF幂(以“反转”对数直方图的效果)。
我做错了什么吗?
这是我的代码。我通过标准输入将数据传输 (cat pop.txt | python hist.py) -- 这里 有一个样本人口。
from pylab import *
import numpy
def laplace(x, mu, b):
    return 10**(1.0/(2*b) * numpy.exp(-abs(x - mu)/b))
def main():
    import sys
    num = map(int, sys.stdin.read().strip().split(' '))
    nbins = max(num) - min(num)
    n, bins, patches = hist(num, nbins, range=(min(num), max(num)), log=True, align='left')
    loc, scale = 0., 1.
    x = numpy.arange(bins[0], bins[-1], 1.)
    pdf = laplace(x, 0., 1.)
    plot(x, pdf)
    width = max(-min(num), max(num))
    xlim((-width, width))
    ylim((1.0, 10**7))
    show()
if __name__ == '__main__':
    main()
编辑
好的,这里尝试将其与普通拉普拉斯分布(而不是对数拉普拉斯分布)匹配。与上述尝试的不同之处:
- 直方图已经归一化
- 直方图是线性的(而不是对数的)
laplace函数严格按照维基百科文章中指定的方式定义
输出: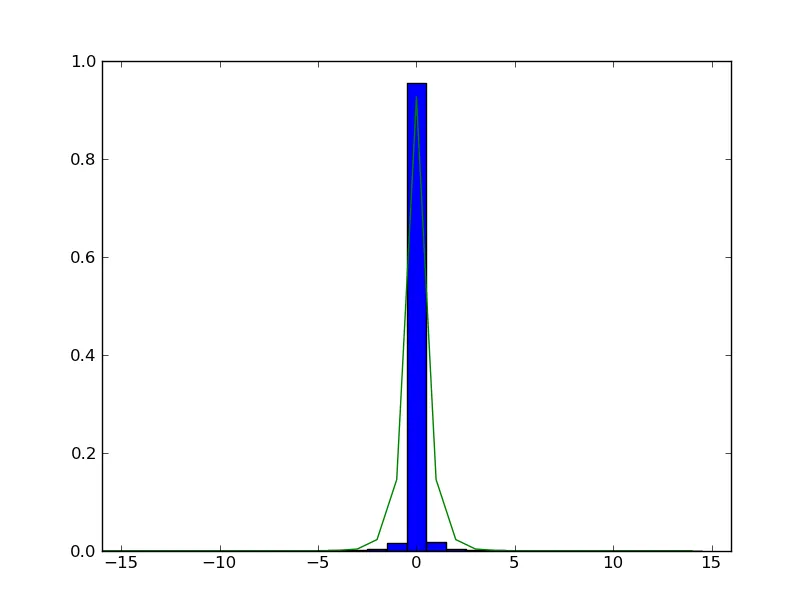
如您所见,它并不是最佳匹配,但是数字(直方图和拉普拉斯PDF)至少现在在同一个范围内。我认为对数拉普拉斯会更好地匹配。我的方法(源代码在上面)没有奏效。有人能建议一种可行的方法吗?
来源:
from pylab import *
import numpy
def laplace(x, mu, b):
    return 1.0/(2*b) * numpy.exp(-abs(x - mu)/b)
def main():
    import sys
    num = map(int, sys.stdin.read().strip().split(' '))
    nbins = max(num) - min(num)
    n, bins, patches = hist(num, nbins, range=(min(num), max(num)), log=False, align='left', normed=True)
    loc, scale = 0., 0.54
    x = numpy.arange(bins[0], bins[-1], 1.)
    pdf = laplace(x, loc, scale)
    plot(x, pdf)
    width = max(-min(num), max(num))
    xlim((-width, width))
        show()
if __name__ == '__main__':
    main()