据我所知,直方图函数中的Log=True选项仅涉及y轴。
P.hist(d,bins=50,log=True,alpha=0.5,color='b',histtype='step')
我需要将 bins 在 log10 中等间距分布。有什么方法可以实现吗?
P.hist(d,bins=50,log=True,alpha=0.5,color='b',histtype='step')
我需要将 bins 在 log10 中等间距分布。有什么方法可以实现吗?
使用logspace()创建一个等比数列,并将其传递给bins参数。并将x轴的刻度设置为对数刻度。
import pylab as pl
import numpy as np

data = np.random.normal(size=10000)
pl.hist(data, bins=np.logspace(np.log10(0.1),np.log10(1.0), 50))
pl.gca().set_xscale("log")
pl.show()
np.logspace(0.1,1.0,...)将创建一个范围从10**0.1到10**1.0,而不是从0.1到1.0。 - Andre Holznernp.logspace(np.log10(0.1),np.log10(1.0),50)。 - JoseOrtiz3最直接的方法就是计算限制范围的log10值,计算出等距的线性间隔,并通过将其乘以10的幂来转换回去。
import pylab as pl
import numpy as np
data = np.random.normal(size=10000)
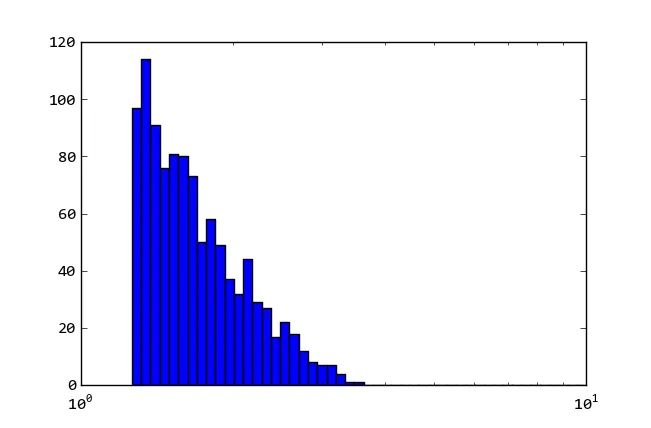
MIN, MAX = .01, 10.0
pl.figure()
pl.hist(data, bins = 10 ** np.linspace(np.log10(MIN), np.log10(MAX), 50))
pl.gca().set_xscale("log")
pl.show()
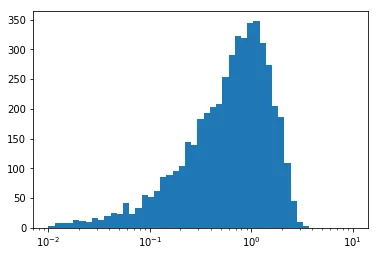
bins='auto'。import numpy as np
import matplotlib.pyplot as plt
data = 10**np.random.normal(size=500)
_, bins = np.histogram(np.log10(data + 1), bins='auto')
plt.hist(data, bins=10**bins);
plt.gca().set_xscale("log")
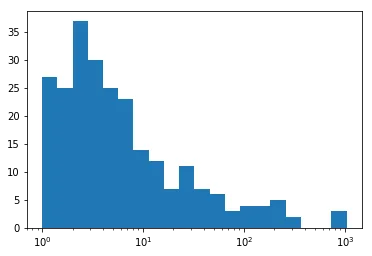
some_column_hist = dataframe['some_column'].plot(bins=np.logspace(-2, np.log10(max_value), 100), kind='hist', loglog=True, xlim=(0,max_value))