问题在标题中已经说明了。我正在尝试使用从bokeh.charts导入的直方图对象,但无法弄清如何以对数刻度显示它。在我的情况下,我需要x轴和y轴都以对数刻度显示。
2个回答
6
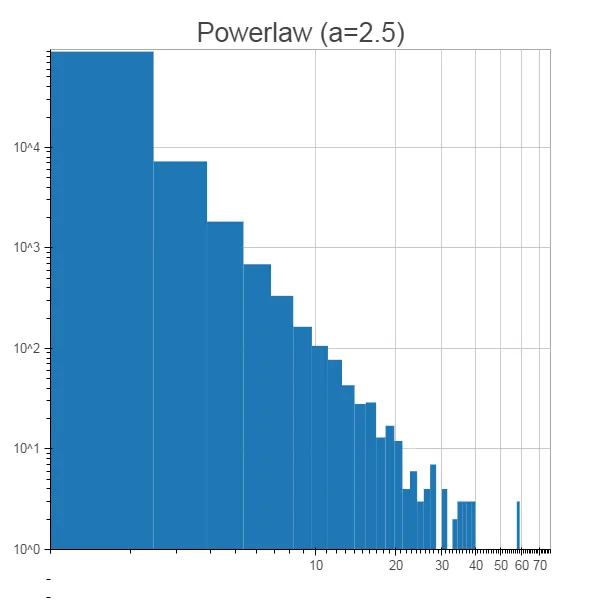
好的,看起来可以使用对数刻度。但是,我应该使用绘图API而不是图表API:
import numpy as np
from bokeh.plotting import figure, show, output_notebook

output_notebook()

# generate random data from a powerlaw
measured = 1/np.random.power(2.5, 100000)

hist, edges = np.histogram(measured, bins=50)

p = figure(title="Power law (a=2.5)", x_axis_type="log", y_axis_type='log')
p.quad(top=hist, bottom=0, left=edges[:-1], right=edges[1:], line_color=None)

show(p)
感谢bigreddot在另一个问题中提供的帮助!
- famargar
网页内容由stack overflow 提供, 点击上面的可以查看英文原文,
原文链接
原文链接