对数y轴的Bokeh直方图

5
使用Bokeh创建直方图可以使用以下代码:
p = Histogram(results, yscale="linear", bins=50, title = 'hist plot')
show(p)

但是yscale的选项只有'linear'、'categorical'和'datetime'

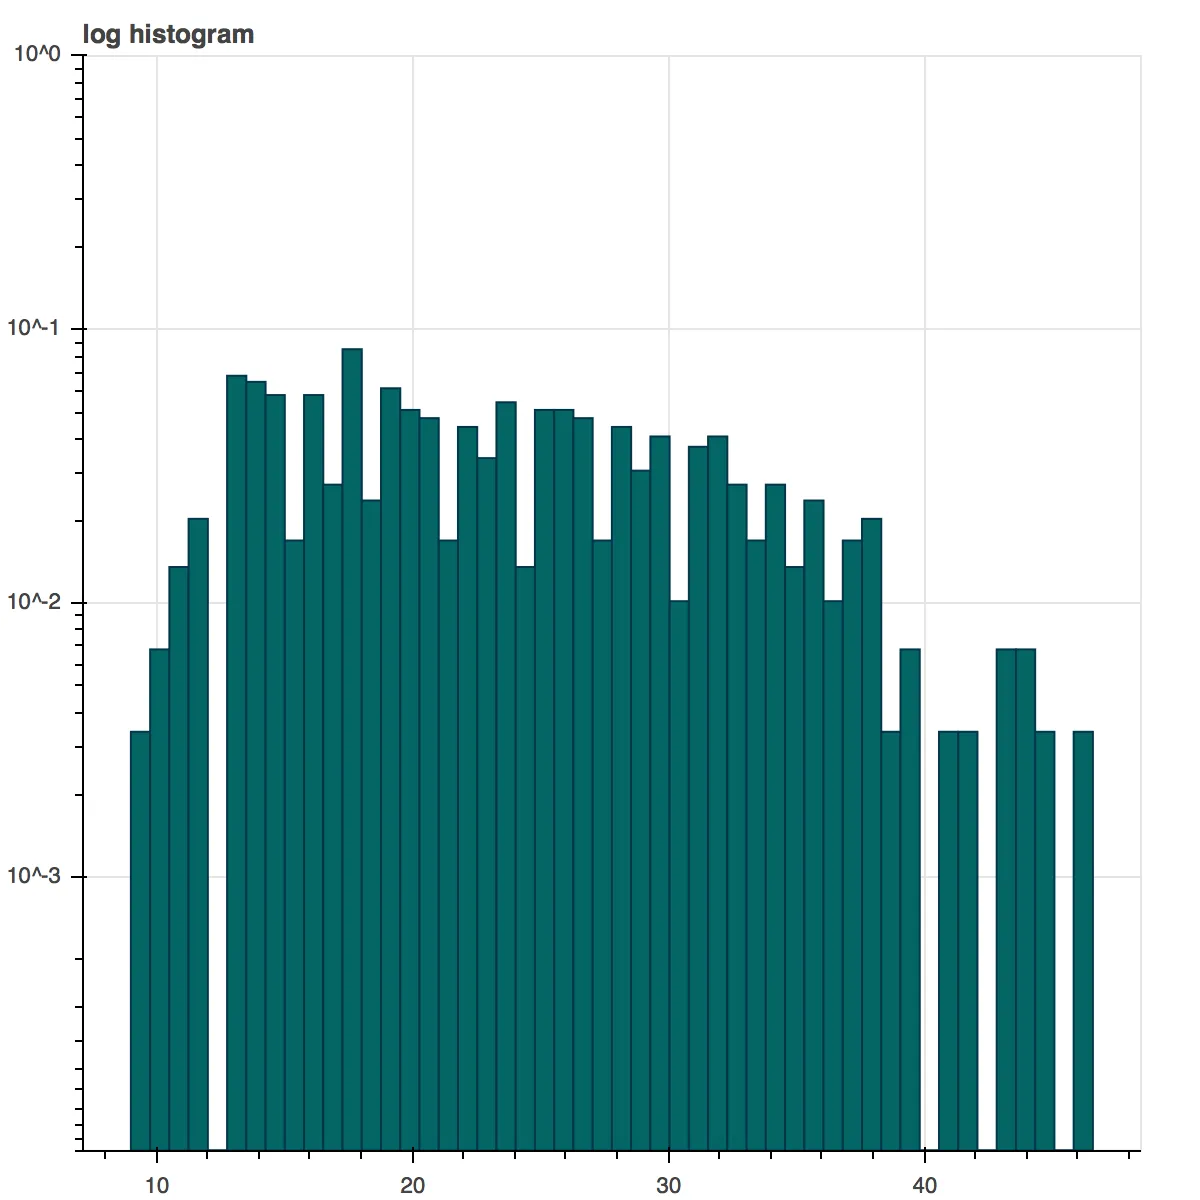
有没有办法创建一个具有对数yscale的直方图呢?

1个回答

5
似乎Histogram不允许这样做,但您可以尝试这种基于低级别的方法(部分基于类似问题的答案和文档中的示例)。
import numpy as np
from bokeh.plotting import figure, show
from bokeh.sampledata.autompg import autompg as df

p = figure(tools="pan,wheel_zoom,box_zoom,reset,previewsave",
       y_axis_type="log", y_range=[10**(-4), 10**0], title="log histogram")

hist, edges = np.histogram(df['mpg'], density=True, bins=50)
p.quad(top=hist, bottom=0, left=edges[:-1], right=edges[1:],
       fill_color="#036564", line_color="#033649")

image generated


2
在 Bokeh 2.4.2 中,使用建议的脚本没有绘制任何内容。为了使其正常工作,我将 "bottom=0" 更改为 "bottom=0.00001"。 - Marmoz

网页内容由stack overflow 提供, 点击上面的
可以查看英文原文,
原文链接