Bokeh,双Y轴,禁用一个轴进行缩放/平移

5

有没有类似于matplotlib ax.set_navigate(False) 命令的功能?

这里是一个使用ipython notebook的最简示例。

from bokeh.plotting import figure
from bokeh.models import LinearAxis, Range1d
from bokeh.io import output_notebook, show
output_notebook()

s1=figure(width=250, plot_height=250, title=None, tools="pan, wheel_zoom")
s1.line([1, 2, 3], [300, 300, 400], color="navy", alpha=0.5)
s1.extra_y_ranges = {"foo": Range1d(start=1, end=9)}
s1.add_layout(LinearAxis(y_range_name="foo"), 'right')
s1.line([1, 2, 3], [4, 4, 1], color="firebrick", alpha=0.5, y_range_name="foo")
show(s1)

在缩放和平移另一个 y 轴时,是否可能将第二个 y 轴固定在原位?
使用 PanTool 尺寸没有帮助我解决这个问题。
编辑:插入截图:
实际输出截图
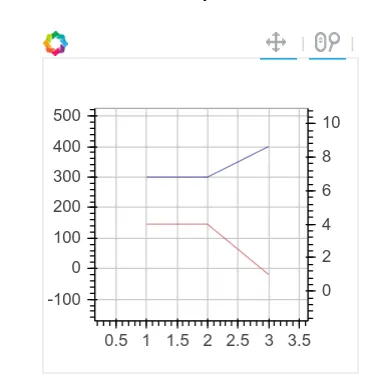
蓝色线绘制在第一个轴上,红色线绘制在第二个轴上
如果我进行缩放,沿着 x 轴平移,我希望红色线保持在原位。
2个回答

4
您可以使用第二个y轴的回调功能来插入JavaScript代码,以便在执行缩放或平移时将范围重置为原始值:
from bokeh.plotting import figure
from bokeh.models import LinearAxis, Range1d, CustomJS
from bokeh.io import output_notebook, show
output_notebook()

jscode="""
        range.set('start', parseInt(%s));
        range.set('end', parseInt(%s));
    """


s1=figure(width=250, plot_height=250, title=None, tools="pan, wheel_zoom")
s1.line([1, 2, 3], [300, 300, 400], color="navy", alpha=0.5)
s1.extra_y_ranges = {"foo": Range1d(start=1, end=9)}
s1.add_layout(LinearAxis(y_range_name="foo"), 'right')
s1.line([1, 2, 3], [4, 4, 1], color="firebrick", alpha=0.5, y_range_name="foo")


s1.extra_y_ranges['foo'].callback = CustomJS(
        args=dict(range=s1.extra_y_ranges['foo']),
                    code=jscode % (s1.extra_y_ranges['foo'].start,
                                   s1.extra_y_ranges['foo'].end)
            )

show(s1)

1
就是这样!使用“回调函数”个性化绘图非常有趣。 - cheesepalm

1

Jakes的答案在bokeh 1.3.4中对我不起作用了。然而,现在可以通过Range1d.bounds属性简单地完成:

from bokeh.plotting import figure
from bokeh.models import LinearAxis, Range1d
from bokeh.io import show

s1 = figure(width=250, plot_height=250, title=None, tools="pan, wheel_zoom")
s1.line([1, 2, 3], [300, 300, 400], color="navy", alpha=0.5)
s1.extra_y_ranges = {"foo": Range1d(start=1, end=9, bounds=(1,9))}
s1.add_layout(LinearAxis(y_range_name="foo"), 'right')
s1.line([1, 2, 3], [4, 4, 1], color="firebrick", alpha=0.5, y_range_name="foo")

show(s1)

网页内容由stack overflow 提供, 点击上面的
可以查看英文原文,
原文链接