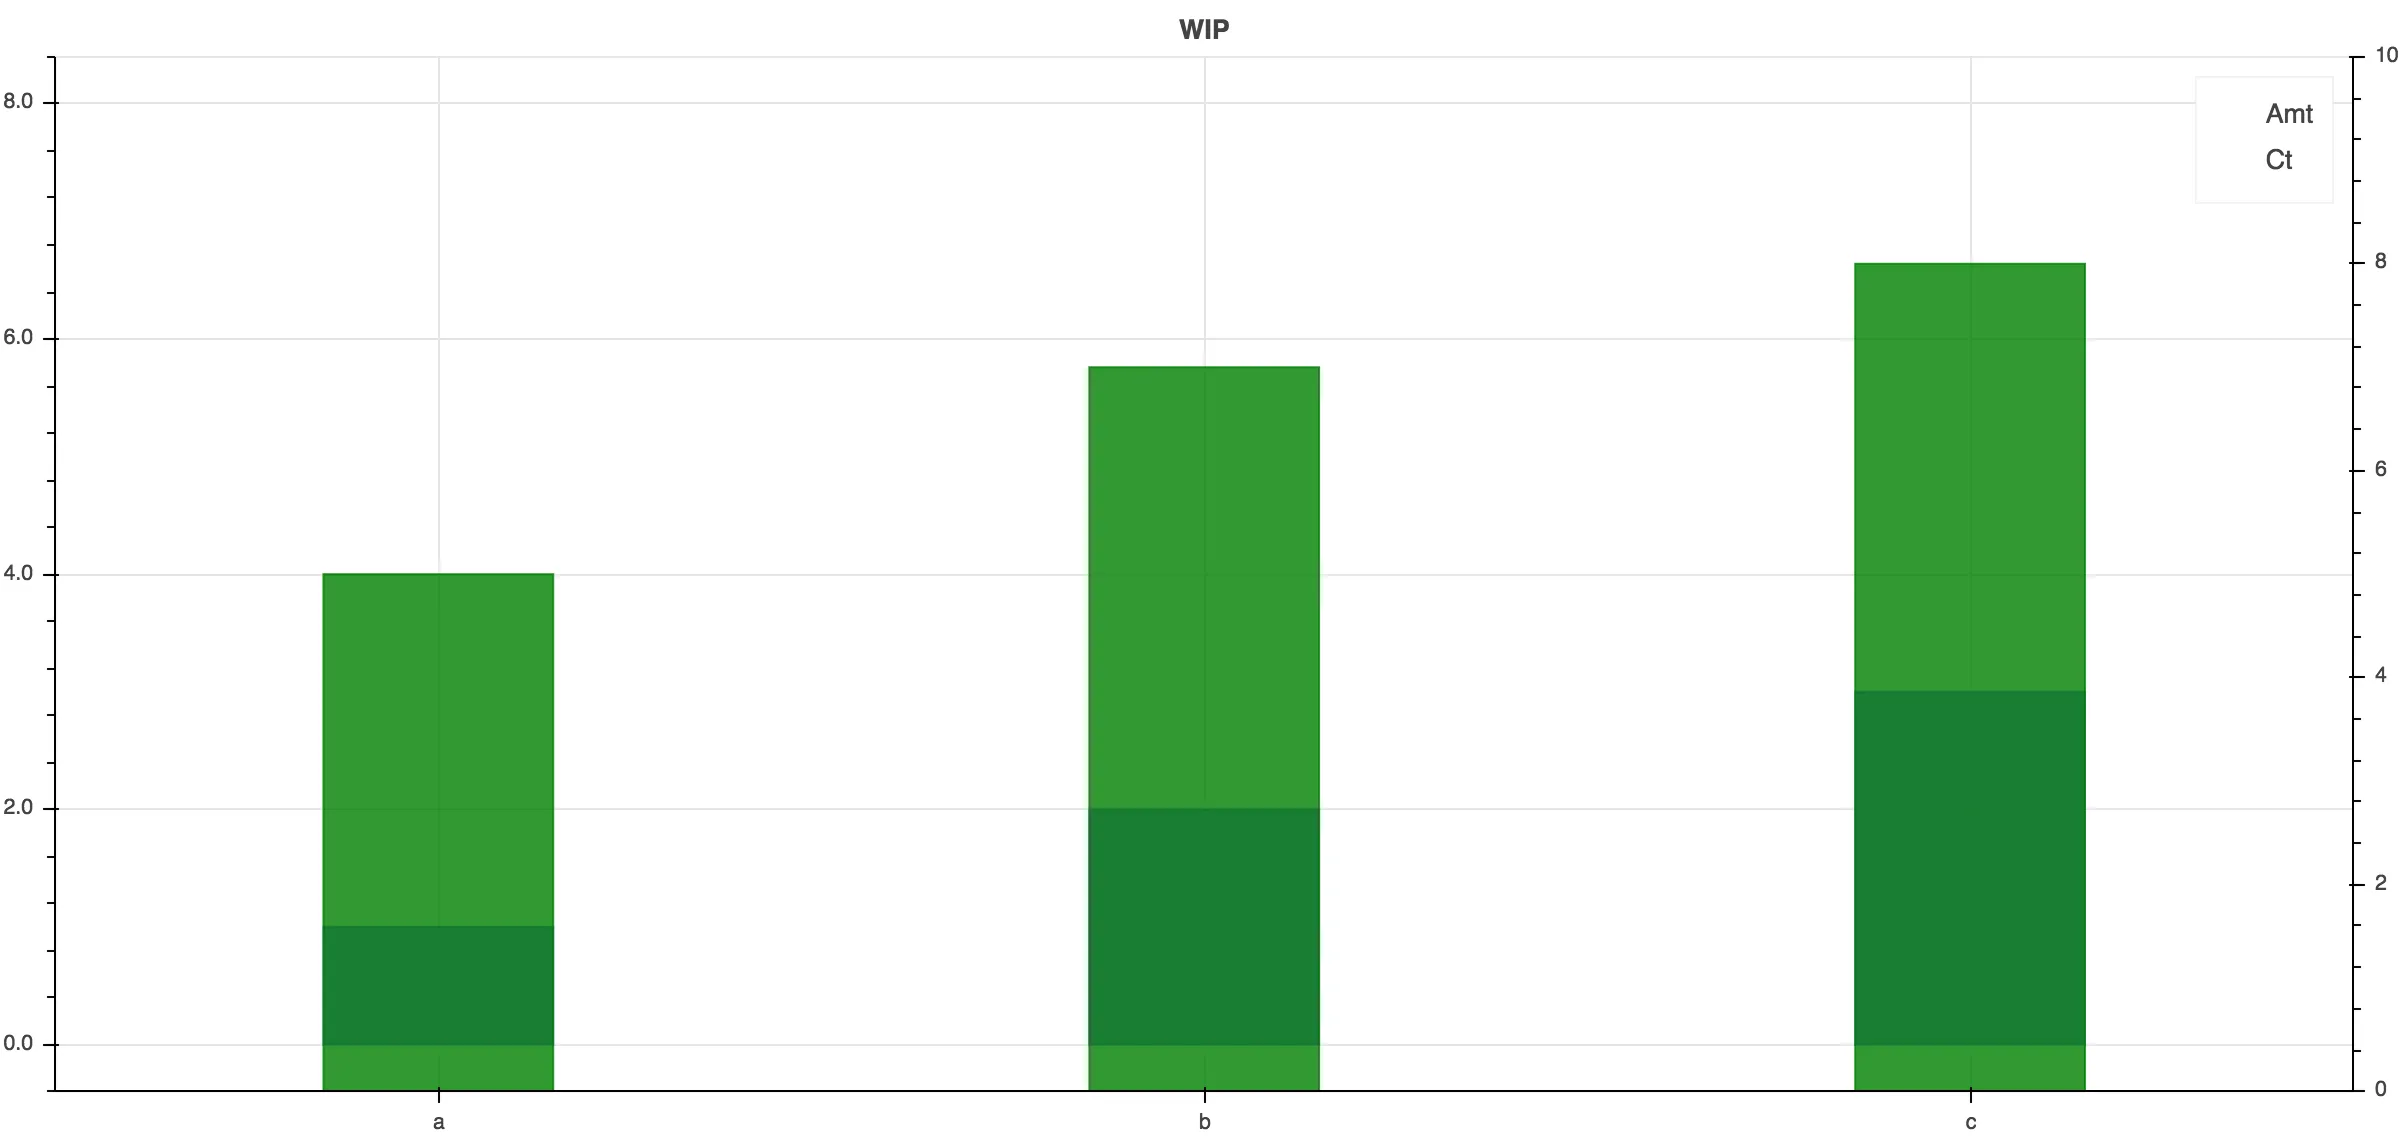
我正在使用bokeh.plotting构建Bokeh图表。我有两个具有共享索引的系列,希望绘制两个垂直条形图。当我只使用一个条形图时,一切工作正常,但是当我添加第二个y轴范围和第二个条形图时,它似乎会影响主要的y轴范围(将值从0到4更改),而我的第二个vbar()会叠加在第一个上面。如果您能就为什么这些条形图重叠而不是并排以及为什么第二个系列/y轴似乎会影响第一个,尽快提供帮助,将不胜感激。
import pandas as pd
import bokeh.plotting as bp
from bokeh.models import NumeralTickFormatter, HoverTool, Range1d, LinearAxis
df_x_series = ['a','b','c']
fig = bp.figure(title='WIP',x_range=df_x_series,plot_width=1200,plot_height=600,toolbar_location='below',toolbar_sticky=False,tools=['reset','save'],active_scroll=None,active_drag=None,active_tap=None)
fig.title.align= 'center'
fig.extra_y_ranges = {'c_count':Range1d(start=0, end=10)}
fig.add_layout(LinearAxis(y_range_name='c_count'), 'right')
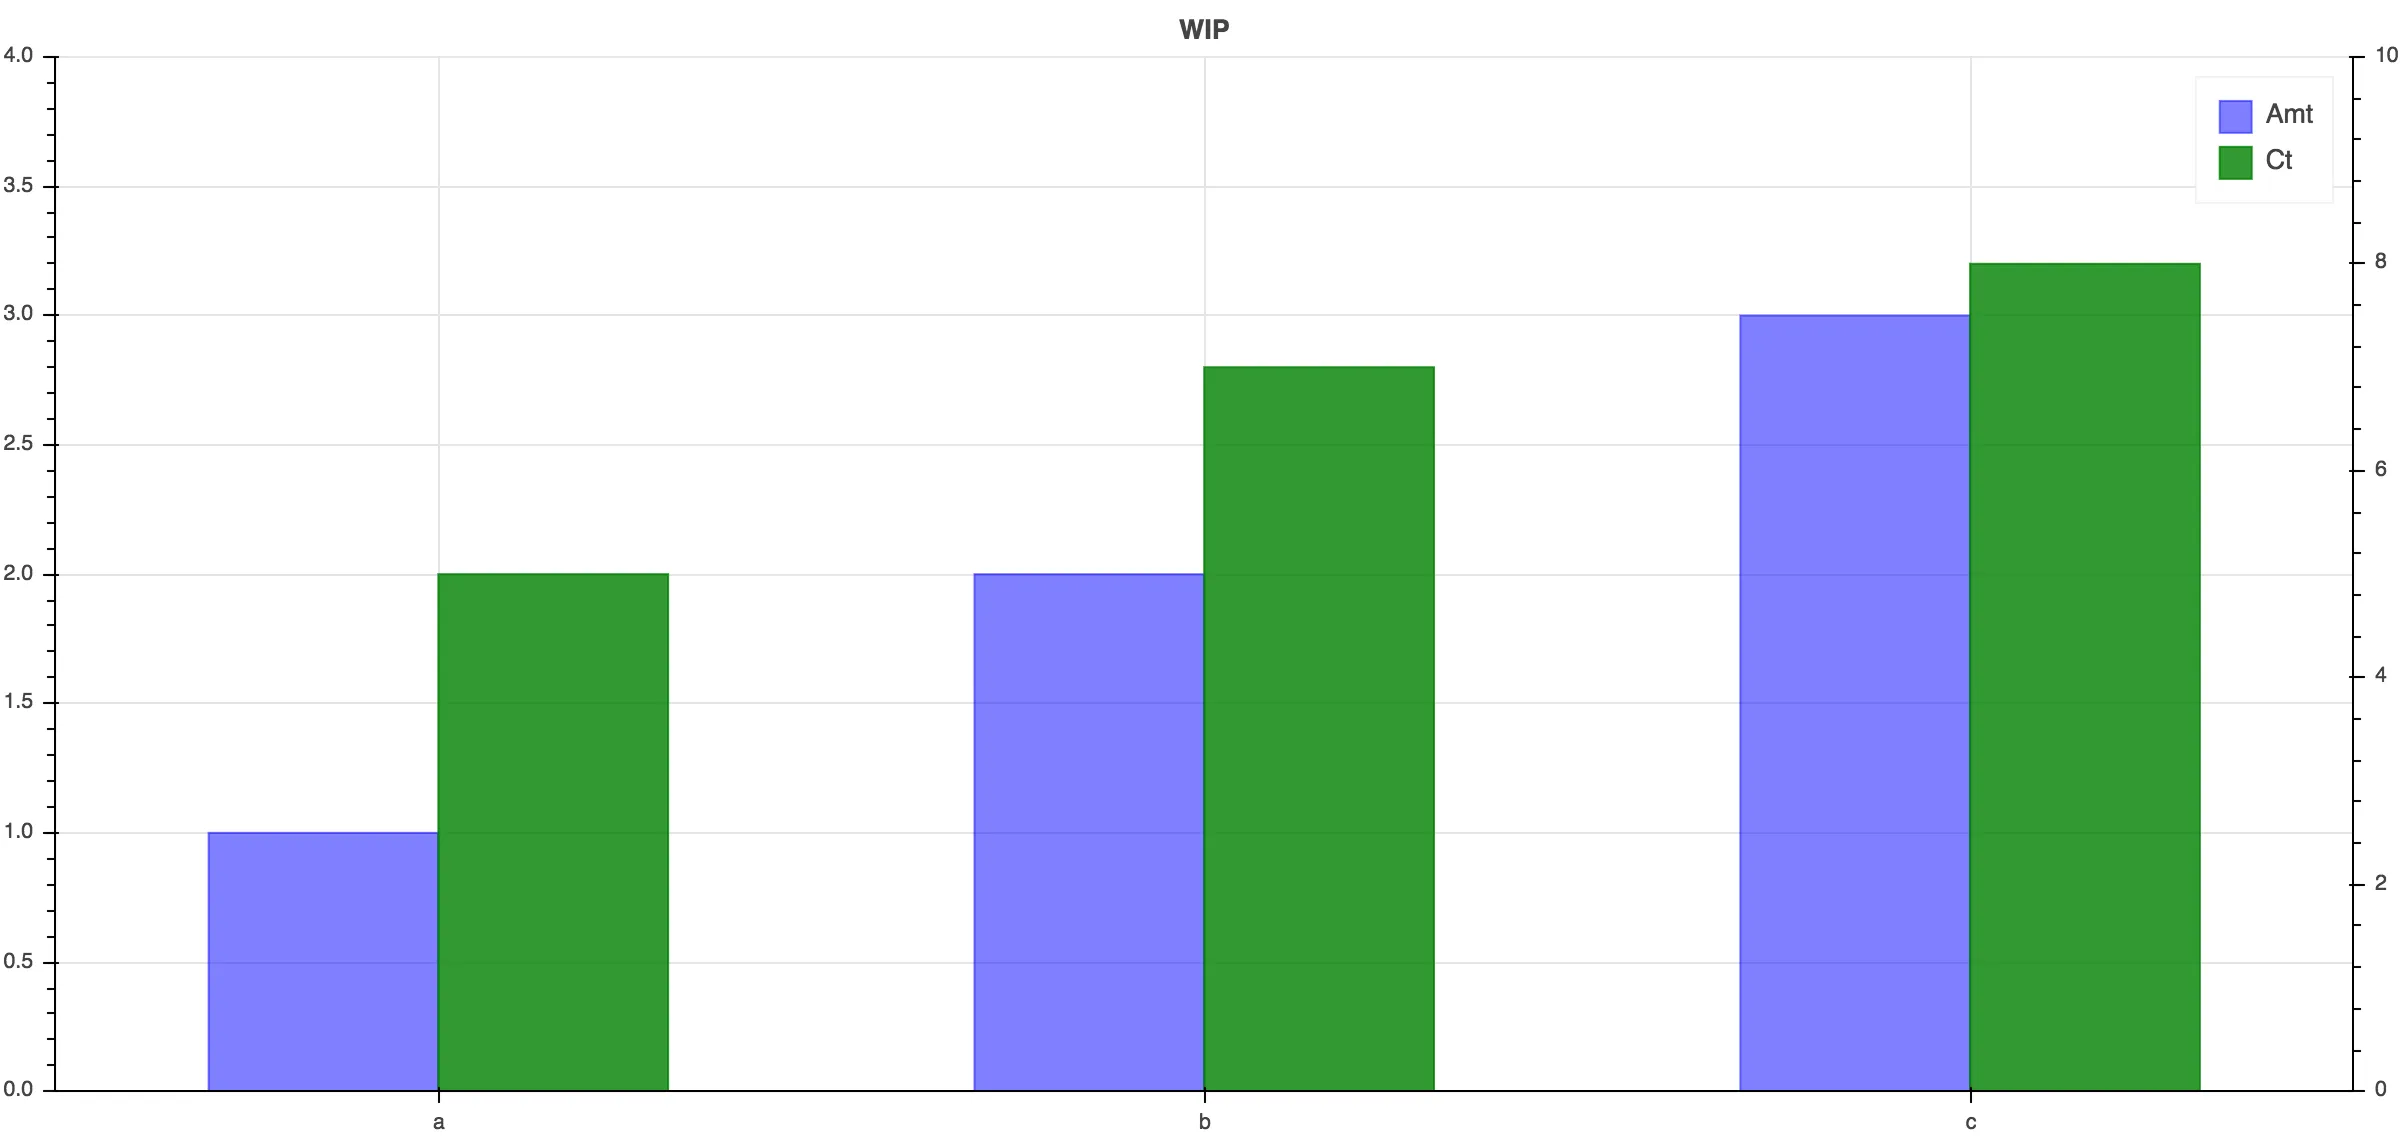
fig.vbar(bottom=0, top=[1,2,3], x=['a','b','c'], color='blue', legend='Amt', width=0.3, alpha=0.5)
fig.vbar(bottom=0, top=[5,7,8], x=['a','b','c'], color='green', legend='Ct', width=0.3, alpha=0.8, y_range_name='c_count')
fig.yaxis[0].formatter = NumeralTickFormatter(format='0.0')
bp.output_file('bar.html')
bp.show(fig)