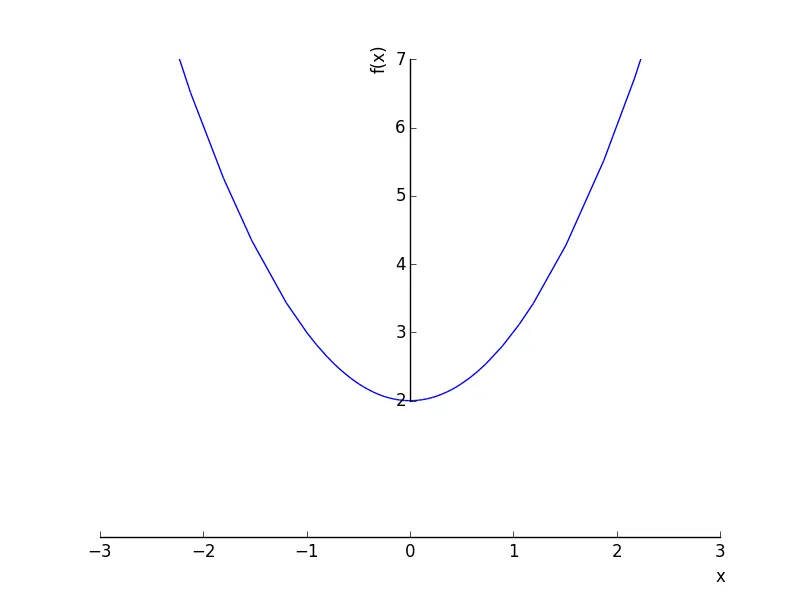
plot((x**2 + 2))
我希望这样做可以使y轴从0到7。
当您绘图时,可以使用kwargs xlim和ylim来设置坐标轴的范围。
xlim
ylim
例如:
>>> plot((x**2 + 2), xlim=[-3,3], ylim=[0,7])