简单的问题:我需要隐藏这段代码生成的图形的y轴:
import matplotlib.pyplot as plt
import seaborn
seaborn.set(style="white")
import random
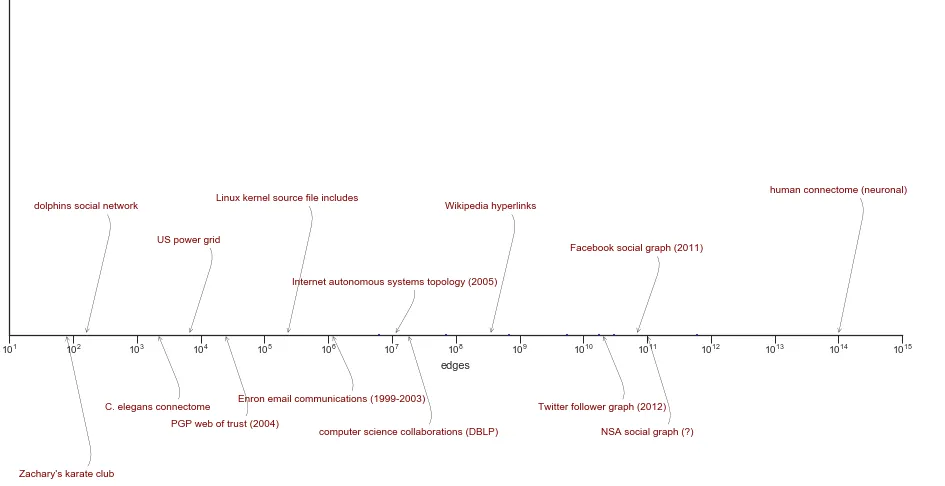
objects = [("Zachary's karate club", 78),
("dolphins social network", 159),
("C. elegans connectome", 2148 ),
("US power grid", 6594 ),
("PGP web of trust (2004)", 24316),
("Linux kernel source file includes", 230213),
("Enron emails (1999-2003)", 1148072),
("Internet autonomous systems (2005)", 11095298),
("CS collaborations (DBLP)", 18e6),
("Wikipedia hyperlinks", 350e6),
("Twitter follower graph (2012)", 20e9),
("Facebook social graph (2011)", 68.7e9),
("NSA social graph (?)", 1e11),
("human connectome (neuronal)", 1e14)
]
fig, ax = plt.subplots(figsize=(16,6))
for i, (name, radius) in enumerate(objects):
sgn = 2 * (i % 2) - 1
ax.annotate(name, xy=(radius,0), xytext=(radius,sgn* (0.5 + random.randint(1,12) * 0.1)), ha='center',
arrowprops=dict(arrowstyle="->", connectionstyle="arc,angleA=0,armA=30,rad=30", facecolor='gray'),
color="Maroon")
ax.set_xscale('log')
ax.set_xlim(1.e1,1.e15)
ax.set_ylim(0,4)
ax.axes.get_yaxis().set_visible(False)
ax.axhline(color='k', lw=1)
ax.plot([obj[1] for obj in objects], [0]*len(objects), 'ob', markersize=2)
ax.set_yticks([])
ax.tick_params(length=8)
ax.set_xlabel('edges')
seaborn.despine()
plt.show()
看起来很简单,但是我找到的所有代码示例都不起作用,例如:fig.axes[0].get_yaxis().set_visible(False)