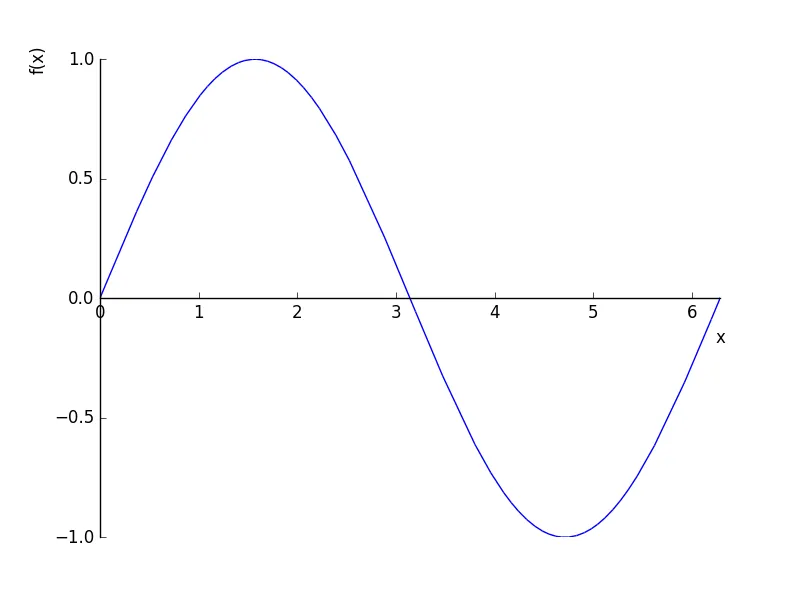
我想使用Sympy显示一个带有绘图的网格:
import sympy
from sympy import sin
from sympy.abc import x
from math import pi
sympy.plot(sin(x),xlim=(0,2*pi))
import matplotlib.pylab as plt
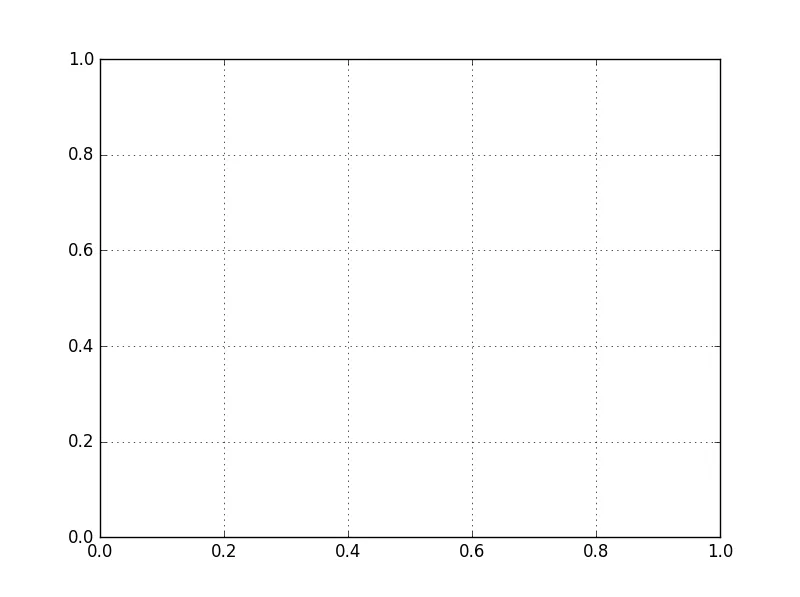
plt.grid(True)
plt.show()
我该如何使用Sympy实现这个?
我想使用Sympy显示一个带有绘图的网格:
import sympy
from sympy import sin
from sympy.abc import x
from math import pi
sympy.plot(sin(x),xlim=(0,2*pi))
import matplotlib.pylab as plt
plt.grid(True)
plt.show()
我该如何使用Sympy实现这个?
由于SymPy在内部使用matplotlib,如果您有可用的话,您可以使用以下命令:
from matplotlib import style
style.use('ggplot')
您可以使用 sympy.plot() 函数来设置样式。
要打印所有可用的样式,请使用:
import matplotlib as plt
print(plt.style.available)
这里是有关Matplotlib样式的链接
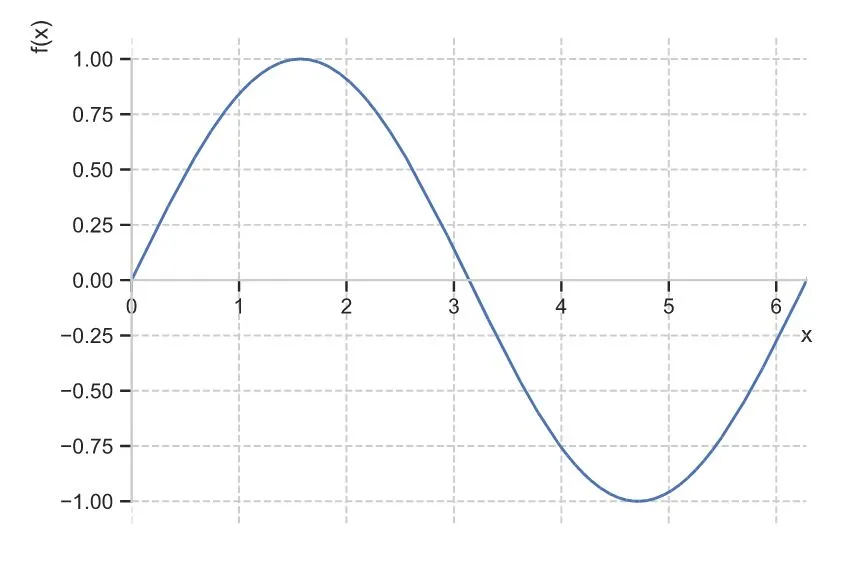
import seaborn as sns
sns.set()
sns.set_style("whitegrid", {'grid.linestyle': '--'})
import sympy
from sympy import sin
from sympy.abc import x
from math import pi
import seaborn as sns
sns.set()
sns.set_style("whitegrid", {'grid.linestyle': '--'})

sympy.plot(sin(x),xlim=(0,2*pi))