如何在matplotlib绘图中添加坐标轴偏移量?

7
我正在seaborn上绘制几个点图,并将它们绘制在同一张图上。x轴是有序的,而不是数值的;每个点图的有序值相同。我想将每个图稍微向一侧移动,就像在单个图内多行之间使用pointplot(dodge=...)参数一样,但这种情况针对多个不同的图绘制在彼此之上。我该怎么做?
理想情况下,我想要一种适用于任何matplotlib图的技术,而不仅仅是针对特定的seaborn。由于数据不是数值型的,所以难以直接添加数据偏移量。
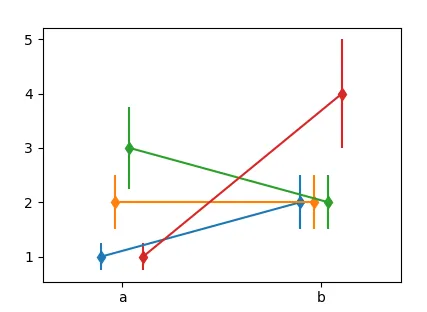
例如,显示图重叠并使它们难以阅读(在每个图中进行闪避处理还可以)
import pandas as pd
import seaborn as sns

df1 = pd.DataFrame({'x':list('ffffssss'), 'y':[1,2,3,4,5,6,7,8], 'h':list('abababab')})
df2 = df1.copy()
df2['y'] = df2['y']+0.5
sns.pointplot(data=df1, x='x', y='y', hue='h', ci='sd', errwidth=2, capsize=0.05, dodge=0.1, markers='<')
sns.pointplot(data=df2, x='x', y='y', hue='h', ci='sd', errwidth=2, capsize=0.05, dodge=0.1, markers='>')

结果

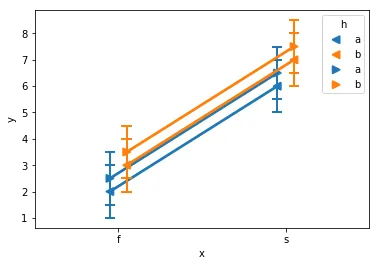
我可以使用其他工具而不是seaborn,但自动置信度/误差条非常方便,所以我更愿意在这里坚持使用seaborn。

2个回答

7

首先回答最常见的情况。可以通过将图中的艺术家向某个方向移动来实现躲避。使用点作为移动单位可能会很有用。例如,您可能希望在图上将标记移动5个点。
这种移动可以通过向艺术家的数据变换添加一个平移来实现。在这里,我提议使用ScaledTranslation

现在为了保持最一般化,可以编写一个函数,该函数接受绘图方法、坐标轴和数据作为输入,并且还要应用一些躲避,例如:

draw_dodge(ax.errorbar, X, y, yerr =y/4., ax=ax, dodge=d, marker="d" )

完整的功能代码:
import matplotlib.pyplot as plt
from matplotlib import transforms
import numpy as np
import pandas as pd


def draw_dodge(*args, **kwargs):
    func = args[0]
    dodge = kwargs.pop("dodge", 0)
    ax = kwargs.pop("ax", plt.gca())
    trans = ax.transData  + transforms.ScaledTranslation(dodge/72., 0,
                                   ax.figure.dpi_scale_trans)
    artist = func(*args[1:], **kwargs)
    def iterate(artist):
        if hasattr(artist, '__iter__'):
            for obj in artist:
                iterate(obj)
        else:
            artist.set_transform(trans)
    iterate(artist)
    return artist

X = ["a", "b"]
Y = np.array([[1,2],[2,2],[3,2],[1,4]])

Dodge = np.arange(len(Y),dtype=float)*10
Dodge -= Dodge.mean()

fig, ax = plt.subplots()

for y,d in zip(Y,Dodge):
    draw_dodge(ax.errorbar, X, y, yerr =y/4., ax=ax, dodge=d, marker="d" )

ax.margins(x=0.4)
plt.show()

图片描述输入在这里

您可以在ax.plotax.scatter等中使用它。但是不能与任何seaborn函数一起使用,因为它们不返回任何有用的对象。


现在对于所提出的问题,剩下的问题是以有用的格式获取数据。以下是一种选择。

df1 = pd.DataFrame({'x':list('ffffssss'), 
                    'y':[1,2,3,4,5,6,7,8], 
                    'h':list('abababab')})
df2 = df1.copy()
df2['y'] = df2['y']+0.5

N = len(np.unique(df1["x"].values))*len([df1,df2])
Dodge = np.linspace(-N,N,N)/N*10


fig, ax = plt.subplots()
k = 0
for df in [df1,df2]:
    for (n, grp) in df.groupby("h"):
        x = grp.groupby("x").mean()
        std = grp.groupby("x").std()
        draw_dodge(ax.errorbar, x.index, x.values, 
                   yerr =std.values.flatten(), ax=ax, 
                   dodge=Dodge[k], marker="o", label=n)
        k+=1

ax.legend()        
ax.margins(x=0.4)
plt.show()

enter image description here


谢谢,这个代码很好用,是一个非常不错的通用代码。对于任何想要使用它的人,只需要注意一点,它在matplotlib == 2.2.2中运行良好,但在matplotlib == 2.0.0中无法正常工作(ValueError: could not convert string to float: 'a')。我没有进一步调查,所以我不知道最低要求版本是什么。 - Alex I

0

您可以使用 linspace 轻松地将图形移动到您想要它们开始和结束的位置。该函数还使缩放图形变得非常容易,以便它们在视觉上具有相同的宽度。

import numpy as np
import matplotlib.pyplot as plt

import numpy as np
import matplotlib.pyplot as plt

start_offset = 3
end_offset = start_offset
y1 = np.random.randint(0, 10, 20) ##y1 has 20 random ints from 0 to 10
y2 = np.random.randint(0, 10, 10) ##y2 has 10 random ints from 0 to 10
x1 = np.linspace(0, 20, y1.size) ##create a number of steps from 0 to 20 equal to y1 array size-1
x2 = np.linspace(0, 20, y2.size)
plt.plot(x1, y1)
plt.plot(x2, y2)
plt.show()

网页内容由stack overflow 提供, 点击上面的
可以查看英文原文,
原文链接