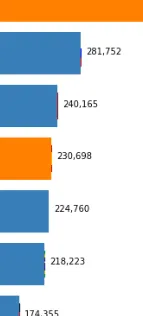
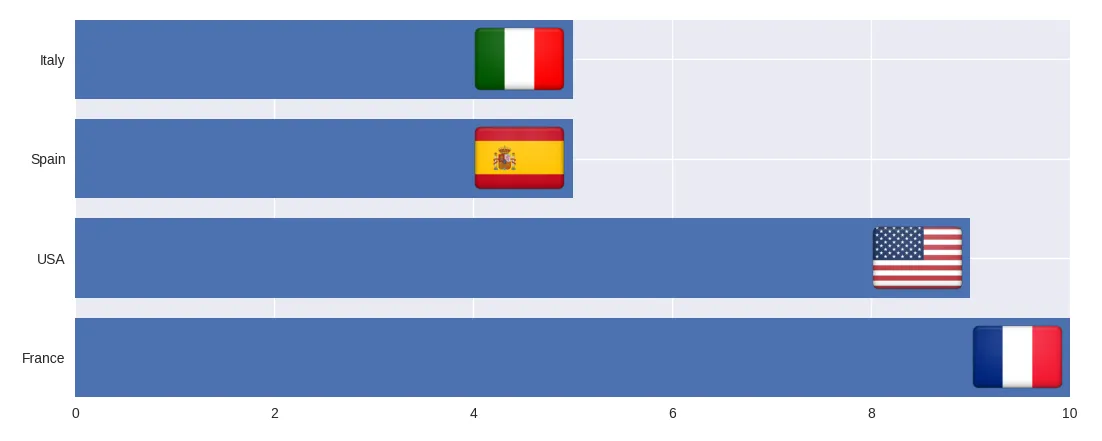
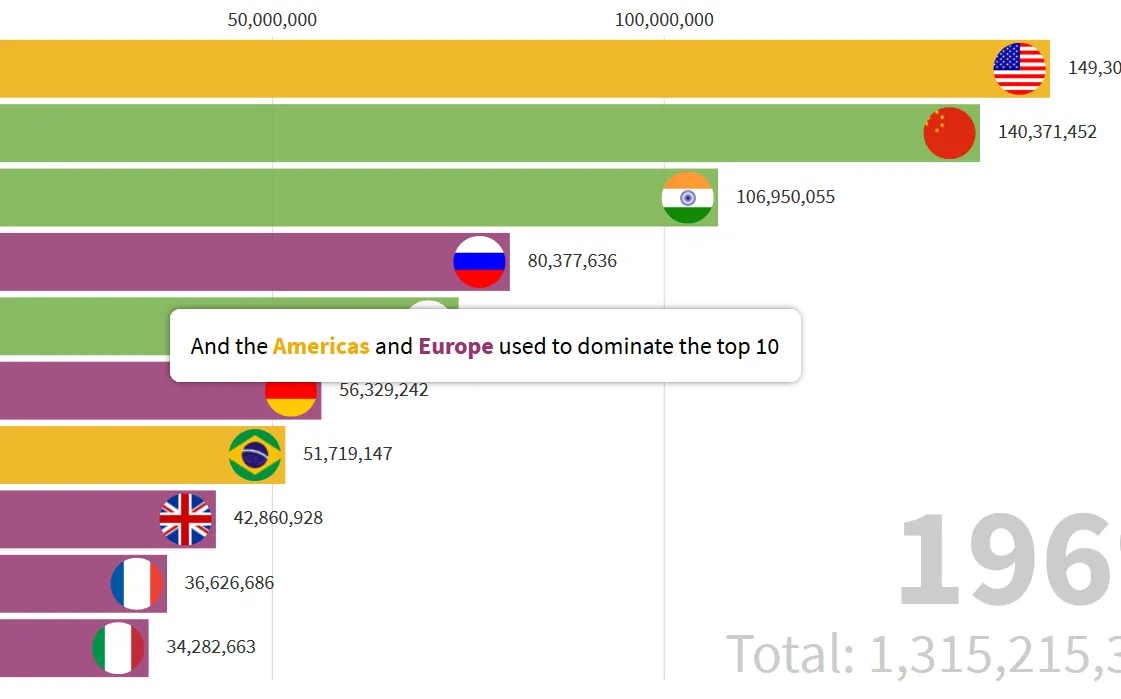
如何在坐标轴中添加图像(matplotlib)的条形图?

7
我想在我的条形图上添加如下的国旗图片: enter image description here 
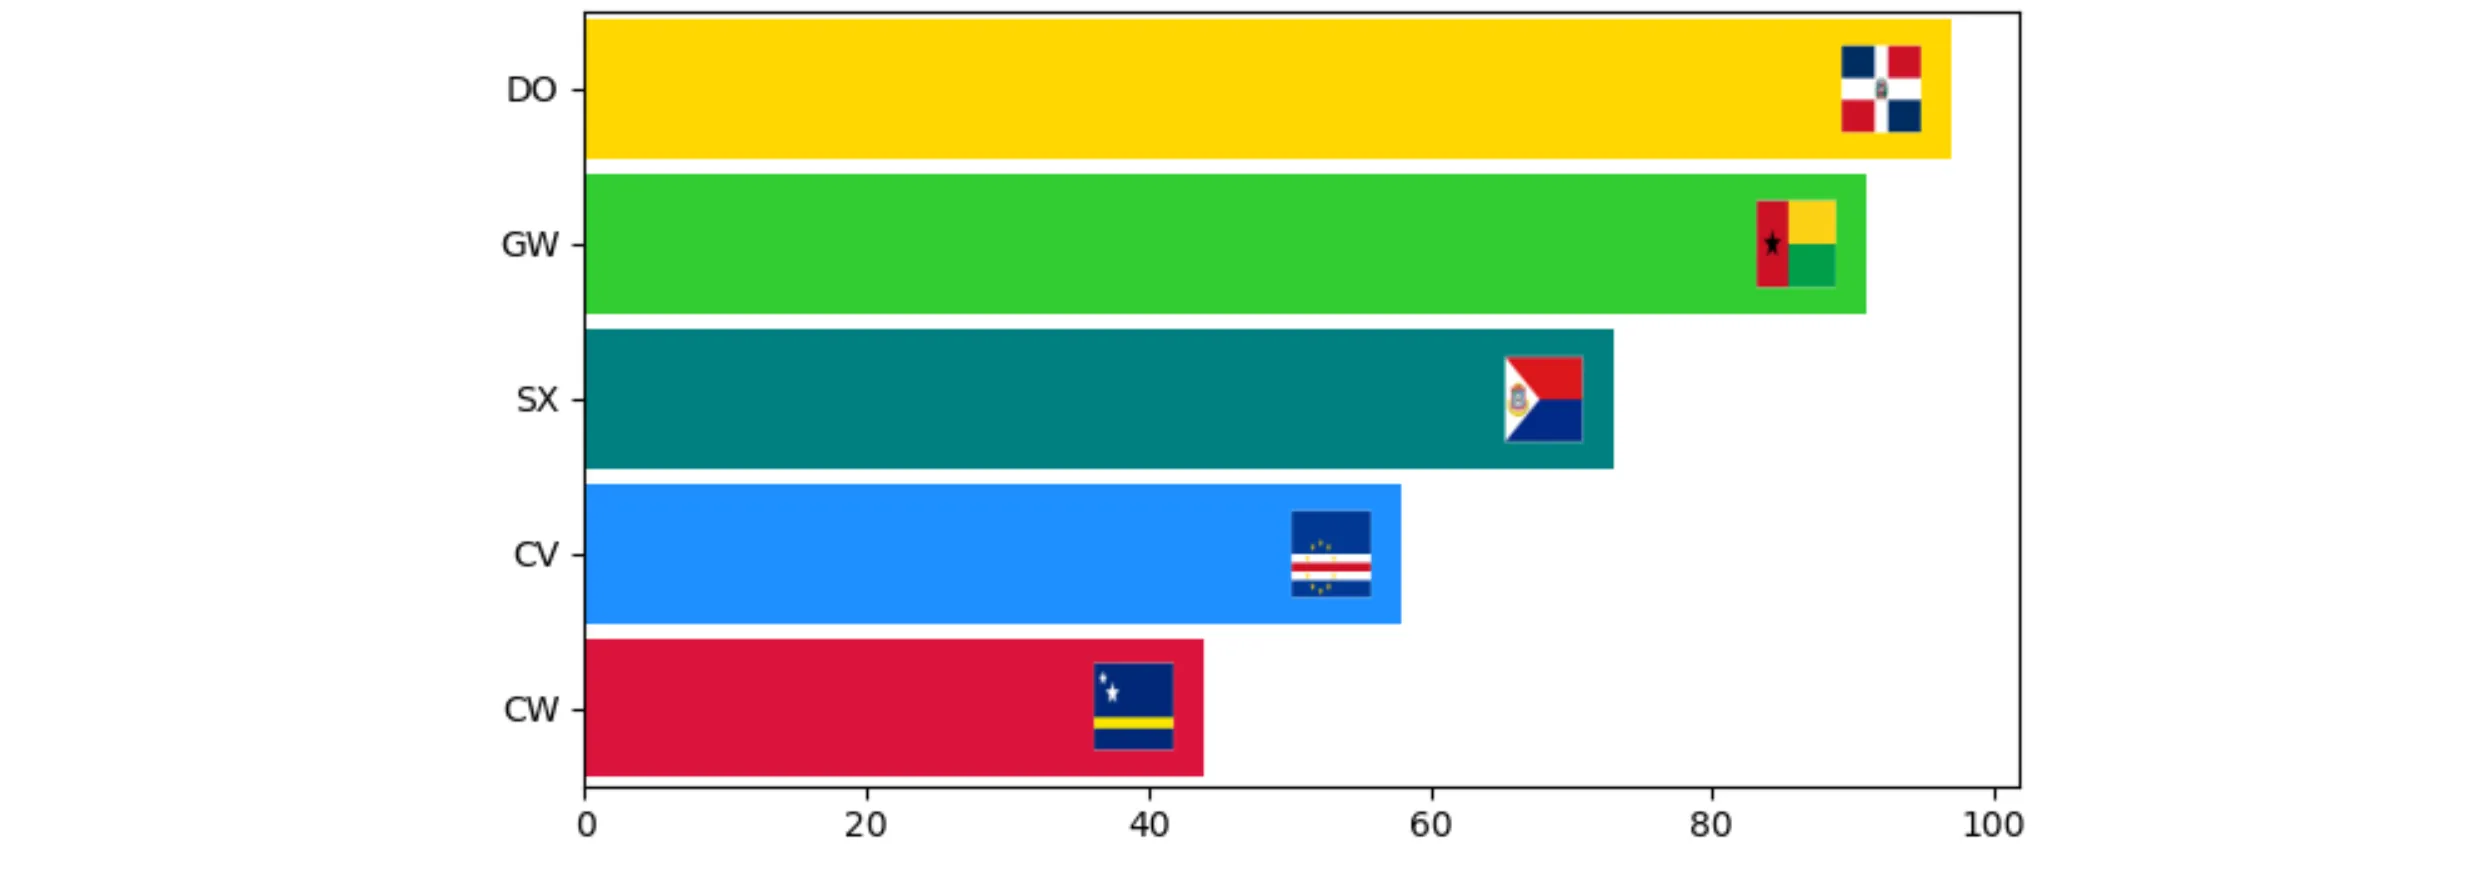
我已经尝试过AnnotationBbox,但它显示为方框轮廓。有没有人可以告诉我如何完全实现上面的图片?
编辑:
以下是我的代码
ax.barh(y = y, width = values, color = r, height = 0.8)

height = 0.8
for i, (value, url) in enumerate(zip(values, image_urls)):
    response = requests.get(url)
    img = Image.open(BytesIO(response.content))

    width, height = img.size
    left = 10
    top = 10
    right = width-10
    bottom = height-10
    im1 = img.crop((left, top, right, bottom)) 
    print(im1.size)
    im1

    ax.imshow(im1, extent = [value - 6, value, i - height / 2, i + height / 2], aspect = 'auto', zorder = 2)
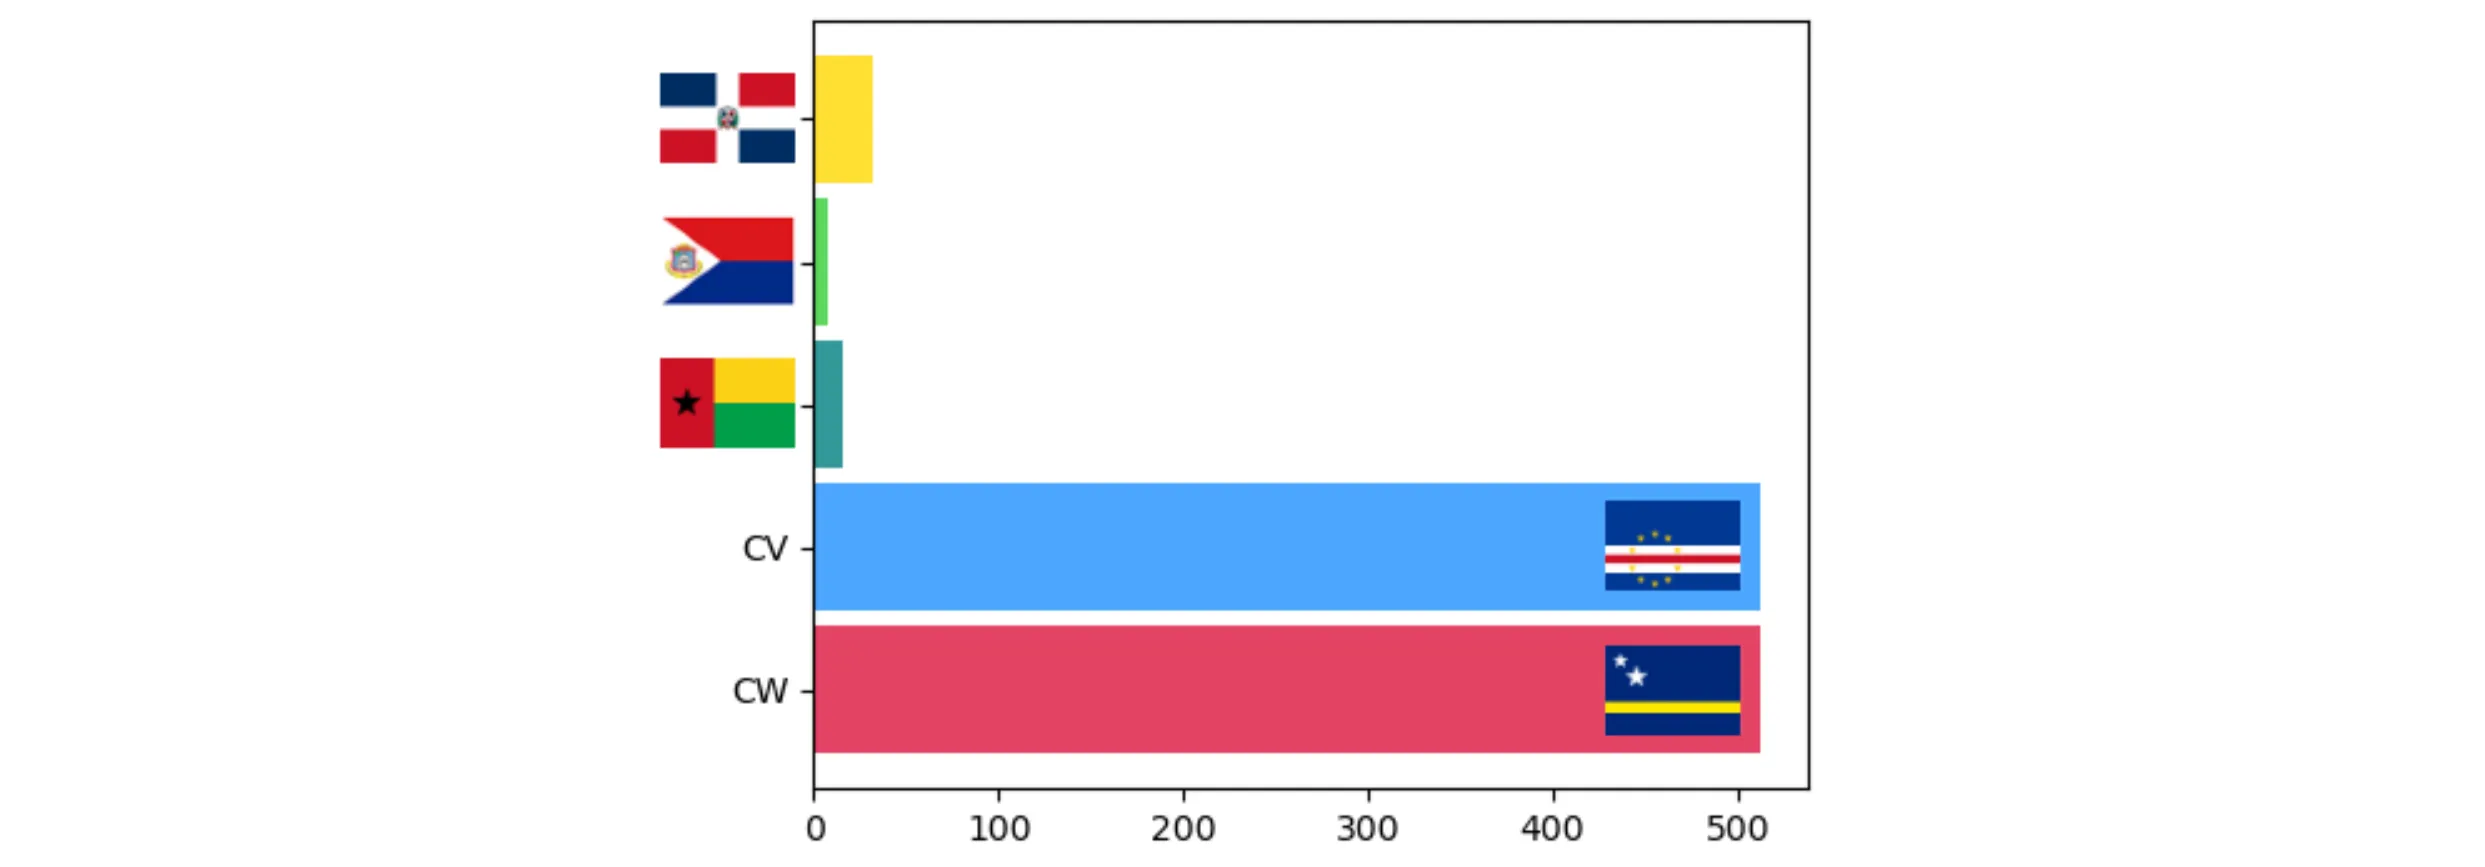
编辑2:

height = 0.8
for j, (value, url) in enumerate(zip(ww, image_urls)):
    response = requests.get(url)
    img = Image.open(BytesIO(response.content))
    ax.imshow(img, extent = [value - 6, value - 2, j - height / 2, j + height / 2], aspect = 'auto', zorder = 2)

ax.set_xlim(0, max(ww)*1.05)
ax.set_ylim(-0.5, len(yy) - 0.5)
plt.tight_layout()

enter image description here


看起来答案与在条形图轴刻度标签上添加图像注释非常相似。 - Trenton McKinney
2个回答

6
你需要使用带有透明背景的 .png 格式的图像。(如果图像没有所需的背景,可以使用软件如 Gimp 或 ImageMagick 进行处理。)
使用这样的图像,plt.imshow() 可以将其放置在绘图中。位置由 extent=[x0, x1, y0, y1] 给出。为了防止 imshow 强制等比例缩放,添加 aspect='auto'zorder=2 有助于使图像位于条形图之上。之后,需要显式设置 plt.xlimplt.ylim(也因为 imshow 会对它们进行更改)。
下面的示例代码使用了 'ada.png',因为它是 matplotlib 的标准内容,所以代码可以独立测试。现在它正在从 countryflags.io 加载国旗,参见 this post
请注意,图像被放置在一个框中,data coordinates(在此案例中为 6 宽和 0.9 高)。例如,当图绘制大小调整时,此框将被拉伸。您可能需要根据 x 轴比例和图形大小将 6 更改为其他值。
import numpy as np
import matplotlib.pyplot as plt
# import matplotlib.cbook as cbook
import requests
from io import BytesIO

labels = ['CW', 'CV', 'GW', 'SX', 'DO']
colors = ['crimson', 'dodgerblue', 'teal', 'limegreen', 'gold']
values = 30 + np.random.randint(5, 20, len(labels)).cumsum()

height = 0.9
plt.barh(y=labels, width=values, height=height, color=colors, align='center')

for i, (label, value) in enumerate(zip(labels, values)):
    # load the image corresponding to label into img
    # with cbook.get_sample_data('ada.png') as image_file:
    #    img = plt.imread(image_file)
    response = requests.get(f'https://www.countryflags.io/{label}/flat/64.png')
    img = plt.imread(BytesIO(response.content))
    plt.imshow(img, extent=[value - 8, value - 2, i - height / 2, i + height / 2], aspect='auto', zorder=2)
plt.xlim(0, max(values) * 1.05)
plt.ylim(-0.5, len(labels) - 0.5)
plt.tight_layout()
plt.show()

example plot

PS: 如 Ernest 在评论和 this post 中所解释的那样,使用 OffsetImage 可以保持图像的纵横比。 (而且,xlimylim 也会保持不变。) 当有更多的条形时,图像不会缩小,因此您可能需要尝试在 OffsetImage(img, zoom=0.65) 中的因子和 AnnotationBbox(..., xybox=(-25, 0)) 中的 x 偏移量。

对于长度太短的条形,额外的选项可以将旗帜放在条形外面。或者放在 y 轴左侧。

适用于水平条形的代码可能如下所示:

import numpy as np
import requests
from io import BytesIO
import matplotlib.pyplot as plt
from matplotlib.offsetbox import OffsetImage, AnnotationBbox

def offset_image(x, y, label, bar_is_too_short, ax):
    response = requests.get(f'https://www.countryflags.io/{label}/flat/64.png')
    img = plt.imread(BytesIO(response.content))
    im = OffsetImage(img, zoom=0.65)
    im.image.axes = ax
    x_offset = -25
    if bar_is_too_short:
        x = 0
    ab = AnnotationBbox(im, (x, y), xybox=(x_offset, 0), frameon=False,
                        xycoords='data', boxcoords="offset points", pad=0)
    ax.add_artist(ab)

labels = ['CW', 'CV', 'GW', 'SX', 'DO']
colors = ['crimson', 'dodgerblue', 'teal', 'limegreen', 'gold']
values = 2 ** np.random.randint(2, 10, len(labels))

height = 0.9
plt.barh(y=labels, width=values, height=height, color=colors, align='center', alpha=0.8)

max_value = values.max()
for i, (label, value) in enumerate(zip(labels, values)):
    offset_image(value, i, label, bar_is_too_short=value < max_value / 10, ax=plt.gca())
plt.subplots_adjust(left=0.15)
plt.show()

example using <code>OffsetImage</code>


我遇到了错误:“191841060x533像素的图像尺寸太大了。每个方向上必须小于2^16。” 我正在使用44x44的图像进行绘制。 - Hassan Zaheer
谢谢。图像大小问题已经解决。我没有为轴设置限制。但现在我发现图像出现在条形边缘处。可能是什么原因呢? - Hassan Zaheer
1
你可以尝试在 extent=[ ... 中实验 x 值。如果你的 x 轴大约是 300000,你可以选择类似于 extent=[value - 60000, value - 10000, ... 的值。确切的数字很难设置,因为随着你添加更多的条形图或者条形图变得更长或者图形发生变化,它会改变。 - JohanC
2
检查现有的问答。例如,这个建议使用OffsetImage来避免数据坐标问题。 - ImportanceOfBeingErnest
问题在于我有一个值呈现在条形前面。 - Hassan Zaheer
显示剩余3条评论

2
为了补充@johanC的回答,可以在GNU/Linux系统下使用iso-flags-png提供的国旗图标,同时还可以使用iso3166 Python包:
import matplotlib.pyplot as plt
from iso3166 import countries
import matplotlib.image as mpimg


def pos_image(x, y, pays, haut):
    pays = countries.get(pays).alpha2.lower()
    fichier = "/usr/share/iso-flags-png-320x240"
    fichier += f"/{pays}.png"
    im = mpimg.imread(fichier)
    ratio = 4 / 3
    w = ratio * haut
    ax.imshow(im,
              extent=(x - w, x, y, y + haut),
              zorder=2)


plt.style.use('seaborn')
fig, ax = plt.subplots()

liste_pays = [('France', 10), ('USA', 9), ('Spain', 5), ('Italy', 5)]

X = [p[1] for p in liste_pays]
Y = [p[0] for p in liste_pays]

haut = .8
r = ax.barh(y=Y, width=X, height=haut, zorder=1)
y_bar = [rectangle.get_y() for rectangle in r]
for pays, y in zip(liste_pays, y_bar):
    pos_image(pays[1], y, pays[0], haut)


plt.show()

此处提供的是:

这里输入图片描述

网页内容由stack overflow 提供, 点击上面的
可以查看英文原文,
原文链接