如果我绘制一个对数坐标的图形,matplotlib会给我漂亮的实体105,106等。
但为了可读性,我更喜欢1e5、1e6等形式。
我能直接设置轴属性来实现这种方式吗?
一个比较丑陋的Hack方法是:
import matplotlib.pyplot as plt
import numpy as np
x = np.linspace(1, 40, 100);
y = np.linspace(1, 5, 100);
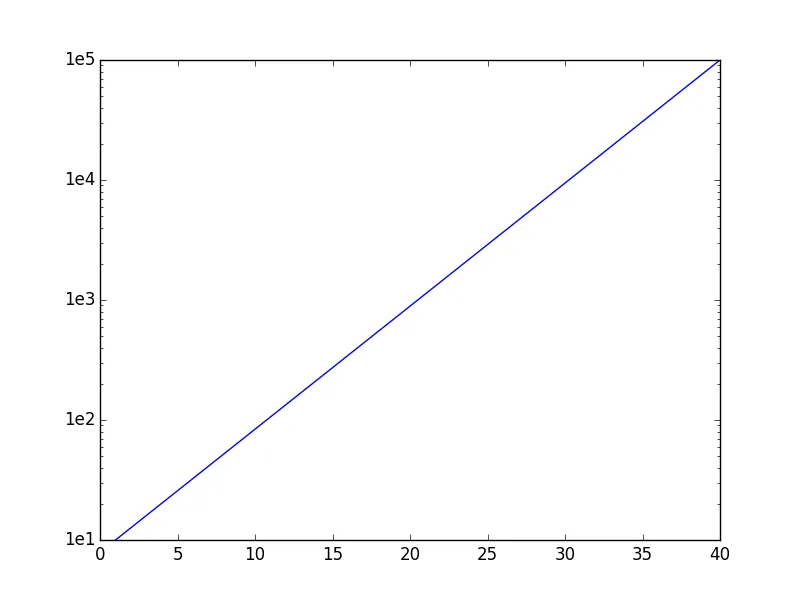
# Actually plot the exponential values
plt.plot(x, 10**y)
ax = plt.gca()
ax.set_yscale('log')
# Rewrite the y labels
y_labels = ax.get_yticks()
ax.set_yticklabels(['1e%i' % np.round(np.log(y)/np.log(10)) for y in y_labels])
plt.show()
但肯定有更好的方法。
ticker和FormatStrFormatter来实现。 - tmdavison