如何在使用matplotlib绘制直方图时旋转坐标轴标签?

4
我有一个如下所示的图表,我想让x轴标签更易读:

enter image description here

这是我尝试过的内容和我得到的错误:

enter image description here

1个回答

17
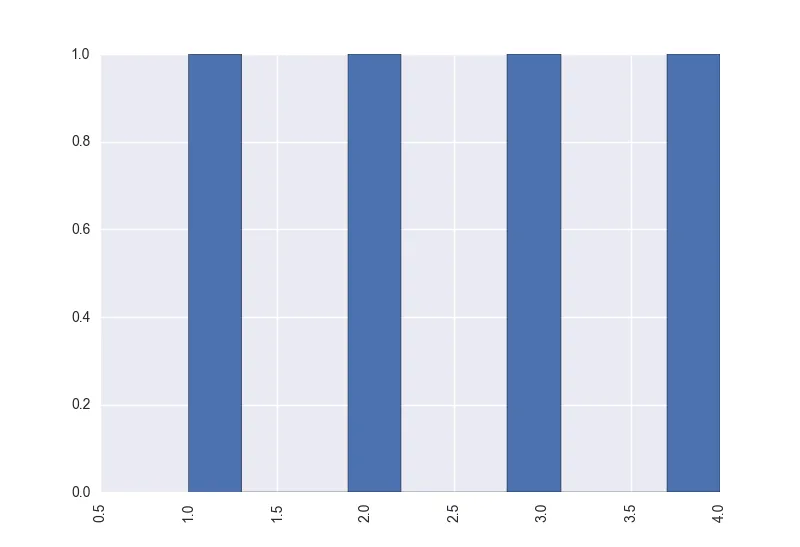
问题在于你正在从对hist()的调用中设置plt,这不是你想要的。通常将matplotlib导入为plt,假设这是这里想要的内容:
import matplotlib.pyplot as plt

data = [1, 2, 3, 4]

p = plt.hist(data)
plt.xticks(rotation='vertical')

plt.show()

输入图像描述


网页内容由stack overflow 提供, 点击上面的
可以查看英文原文,
原文链接