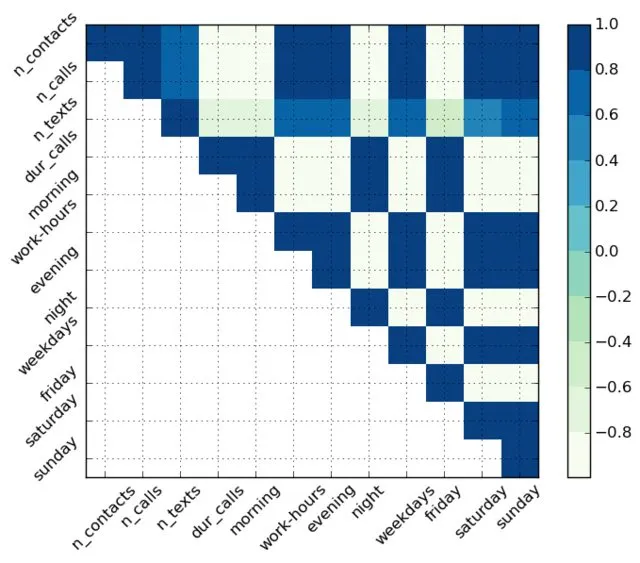
我想绘制一个带有旋转标签的相关矩阵。 然而,如下所示,标签位置错乱。 我尝试查看Matplotlib Python Barplot: Position of xtick labels have irregular spaces between eachother,但我无法在我的情况下使其起作用,因为它建立在条形图的布局上。 使用以下代码添加标签:
    fig  = plt.figure()
    ax1  = fig.add_subplot(111)
    varLabels = ['n_contacts', 'n_calls', 'n_texts', 'dur_calls', 'morning', 'work-hours', 'evening', 'night', 'weekdays', 'friday', 'saturday', 'sunday']

    ax1.set_xticks(np.arange(0,12))
    ax1.set_yticks(np.arange(0,12))
    ax1.set_xticklabels(varLabels, rotation=45);
    ax1.set_yticklabels(varLabels, rotation=45);