例如,假设我有一些数据。
countries = ["Norway", "Spain", "Germany", "Canada", "China"]
valuesA = [20, 15, 30, 5, 26]
valuesB = [1, 5, 3, 6, 2]
我确实想要像这样绘制它们
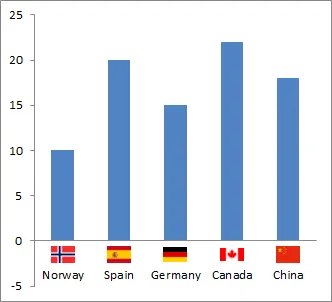 .
.
我该如何将这些旗帜图片放入图表中(如果可能的话)? 其次,我如何自动化这个过程?
例如,假设我有一些数据。
countries = ["Norway", "Spain", "Germany", "Canada", "China"]
valuesA = [20, 15, 30, 5, 26]
valuesB = [1, 5, 3, 6, 2]
我确实想要像这样绘制它们
.
我该如何将这些旗帜图片放入图表中(如果可能的话)? 其次,我如何自动化这个过程?
这种解决方案适用于使用 matplotlib、seaborn 和 pandas.DataFrame.plot 生成的轴级图。
主要思路是将问题分解为小块:
将标记作为数组传入脚本。例如:
 def get_flag(name):
     path = "path/to/flag/{}.png".format(name)
     im = plt.imread(path)
     return im
在图中的特定位置放置图片,可以使用OffsetImage。可以在matplotlib页面上找到示例。最好使用一个函数,该函数接受国家名称和位置作为参数,并生成带有OffsetImage的AnnotationBbox。
使用ax.bar绘制条形图。要将国家名称设置为刻度标签,请使用ax.set_ticklabels(countries)。然后对于每个国家,使用循环放置上面的OffsetImage。
(coord, 0)和xybox=(0., -16.)可以调整以将图像注释放置在任何位置。
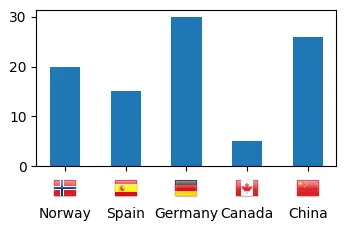
最终结果可能类似于这样:
import numpy as np
import matplotlib.pyplot as plt
from matplotlib.offsetbox import OffsetImage,AnnotationBbox

def get_flag(name):
    path = "data/flags/Flags/flags/flags/24/{}.png".format(name.title())
    im = plt.imread(path)
    return im

def offset_image(coord, name, ax):
    img = get_flag(name)
    im = OffsetImage(img, zoom=0.72)
    im.image.axes = ax

    ab = AnnotationBbox(im, (coord, 0),  xybox=(0., -16.), frameon=False,
                        xycoords='data',  boxcoords="offset points", pad=0)

    ax.add_artist(ab)


countries = ["Norway", "Spain", "Germany", "Canada", "China"]
valuesA = [20, 15, 30, 5, 26]


fig, ax = plt.subplots()

ax.bar(range(len(countries)), valuesA, width=0.5,align="center")
ax.set_xticks(range(len(countries)))
ax.set_xticklabels(countries)
ax.tick_params(axis='x', which='major', pad=26)

for i, c in enumerate(countries):
    offset_image(i, c, ax)

plt.show()