我画了一个图,将两个y轴(即两个不同的S.I.刻度)与一个单独的x轴相关联。我必须放大一些值,并使用Matplotlib中的zoom_inset_locator技巧来管理它。我实现了缩放轴,但是我缺少第二个y轴(请参见下面的示例):
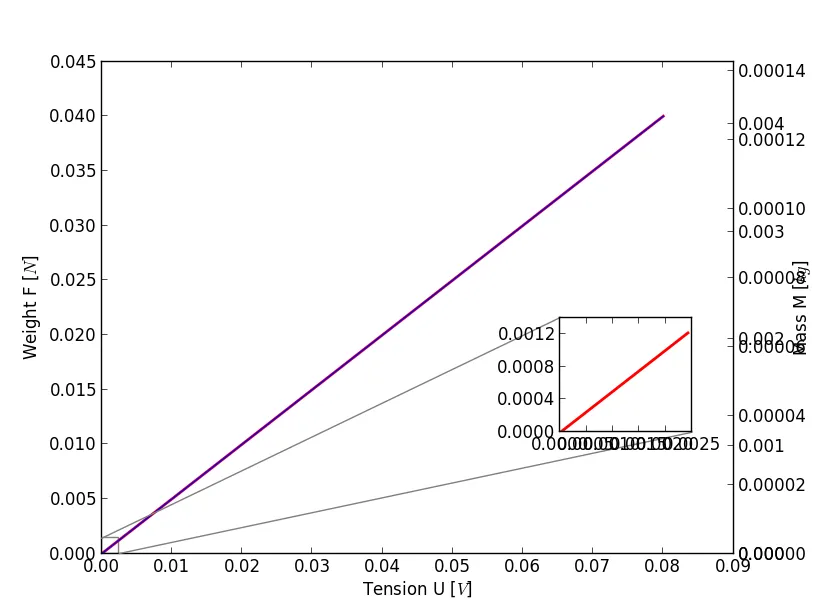
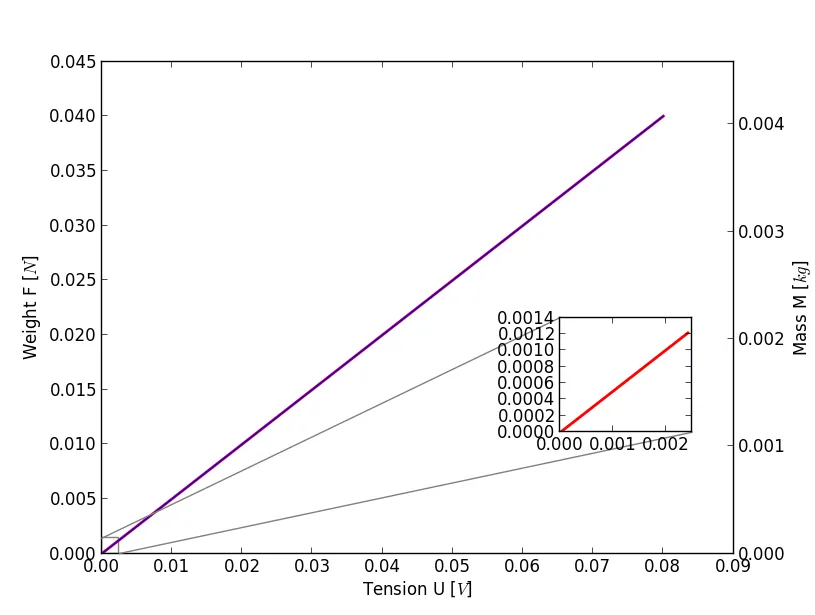 我尝试使用twinx()添加第二个轴,但是失败了,因为它在主twinx(右侧)轴上绘制轴,但在缩放右侧轴上留下空白刻度,并似乎给出了正确的x轴处理,请参见下面的示例:
 有没有解决方法?这是我用于绘制图形的代码:
我尝试使用twinx()添加第二个轴,但是失败了,因为它在主twinx(右侧)轴上绘制轴,但在缩放右侧轴上留下空白刻度,并似乎给出了正确的x轴处理,请参见下面的示例:
有没有解决方法?这是我用于绘制图形的代码:import numpy,os,sys
import pylab
import scipy.optimize
from mpl_toolkits.axes_grid1.inset_locator import zoomed_inset_axes
from mpl_toolkits.axes_grid1.inset_locator import mark_inset
# Initializing the curve
fig_cal=pylab.figure()
host_weight = fig_cal.add_subplot(111)
host_mass = host_weight.twinx()
Tension = numpy.linspace(0,0.08,100)
Weight = 0.5* Tension
Mass = Weight/9.81
# Plotting the curve
host_weight.plot(Tension, Weight, 'r', label='Fitted line',lw=2)
host_mass.plot(Tension, Mass)
# Cosmetic on the Figure
host_weight.set_xlabel("Tension U [$V$]")
host_weight.set_ylabel("Weight F [$N$]")
host_mass.set_ylabel("Mass M [$kg$]")
host_mass.set_ylim(host_weight.axis()[-2]/9.81, host_weight.axis()[-1]/9.81)
host_weight.grid(False)
# Zoom on the first measurement
zoom_weight = zoomed_inset_axes(host_weight, zoom = 7.5, bbox_to_anchor=(0.95,0.5), bbox_transform=host_weight.transAxes)
zoom_weight.plot(Tension[:4], Weight[:4], 'r', lw=2)
zoom_weight.set_xticks(zoom_weight.xaxis.get_majorticklocs()[::2])
zoom_weight.set_yticks(zoom_weight.yaxis.get_majorticklocs()[::2])
# zoom_mass = zoom_weight.twinx()
# zoom_mass.plot(Tension[:4], Mass[:4],alpha=0)
# zoom_mass.set_ylim(zoom_weight.axis()[-2]/9.81,zoom_weight.axis()[-1]/9.81)
mark_inset(host_weight, zoom_weight, loc1=2, loc2=4, fc="none", ec="0.5")
pylab.show()
zoomed_inset_axes功能。 - Chris Zeh