Matplotlib:使用第二个y轴的imshow

7

我正在尝试使用imshow()在matplotlib中绘制一个二维数组,并在第二个y轴上叠加散点图。

oneDim = np.array([0.5,1,2.5,3.7])
twoDim = np.random.rand(8,4)

plt.figure()
ax1 = plt.gca()

ax1.imshow(twoDim, cmap='Purples', interpolation='nearest')
ax1.set_xticks(np.arange(0,twoDim.shape[1],1))
ax1.set_yticks(np.arange(0,twoDim.shape[0],1))
ax1.set_yticklabels(np.arange(0,twoDim.shape[0],1))
ax1.grid()

#This is the line that causes problems
ax2 = ax1.twinx()

#That's not really part of the problem (it seems)
oneDimX = oneDim.shape[0]
oneDimY = 4
ax2.plot(np.arange(0,oneDimX,1),oneDim)
ax2.set_yticks(np.arange(0,oneDimY+1,1))
ax2.set_yticklabels(np.arange(0,oneDimY+1,1))

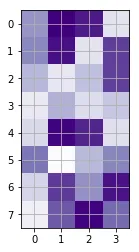
如果我只运行最后一行之前的所有内容,我可以完整地显示我的数组:

That's what it is supposed to look like!

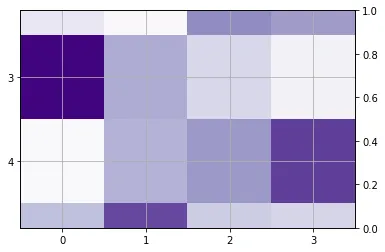
然而,如果我添加第二个y轴(ax2=ax1.twinx())作为散点图的准备工作,它会变成这种不完整的渲染:

Incomplete visualisation of array

什么问题?我在上面的代码中留下了几行描述散点图添加的内容,尽管它似乎不是问题的一部分。

在Python 2.7,matplotlib 2.1.1上复现。这很可能是一个错误。 - DavidG
这里有一个类似的系统:Python 2.7.12,Matplotlib 2.1.1。@DavidG如果这被证明是个bug,是否有任何解决方法来实现这个带有两个y轴的叠加图层? - Chris
2
这个问题在Github上有讨论。显然,这与
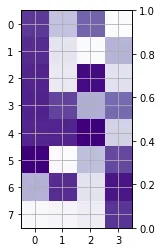
imshow强制ax1的纵横比有关。如果您设置ax1.set_aspect('auto'),则整个图像和绘图将被正确显示,但图像会严重失真。 - Thomas Kühn
1个回答

5

在Thomas Kuehn指出的GitHub讨论后,该问题已于几天前得到解决。由于没有现成的构建版本,这里使用了aspect='auto'属性来进行修复。为了获得漂亮的正常框,我调整了图形的x/y,并使用了轴自动缩放功能来消除一些额外的白色边框。

oneDim = np.array([0.5,1,2.5,3.7])
twoDim = np.random.rand(8,4)

plt.figure(figsize=(twoDim.shape[1]/2,twoDim.shape[0]/2))
ax1 = plt.gca()

ax1.imshow(twoDim, cmap='Purples', interpolation='nearest', aspect='auto')
ax1.set_xticks(np.arange(0,twoDim.shape[1],1))
ax1.set_yticks(np.arange(0,twoDim.shape[0],1))
ax1.set_yticklabels(np.arange(0,twoDim.shape[0],1))
ax1.grid()

ax2 = ax1.twinx()

#Required to remove some white border
ax1.autoscale(False)
ax2.autoscale(False)

结果:

在这里输入图片描述


(注:本翻译文本仅供参考,如有不准确之处请以原始语言为准。)

网页内容由stack overflow 提供, 点击上面的
可以查看英文原文,
原文链接