Matplotlib与brokenaxes包的第二个Y轴

6
我使用brokenaxes包(https://github.com/bendichter/brokenaxes)来打破y轴。现在我想要一个第二个Y轴,它也应该像第一个一样被打破。在下面的示例中,我该如何实现这一点?
import numpy as np
import matplotlib.pyplot as plt
from brokenaxes import brokenaxes
fig, ax = plt.subplots()
plt.gca().axes.get_yaxis().set_visible(False)

bax = brokenaxes(ylims=((0, 1.1), (60, 80)), hspace=.05)
x = np.linspace(0, 1, 100)
bax.plot(x, 5 * np.sin(10 * x) + 70)
bax.plot(x, 0.25* np.cos(40 * x) + 0.5, color="black")

ax2 = ax.twinx()
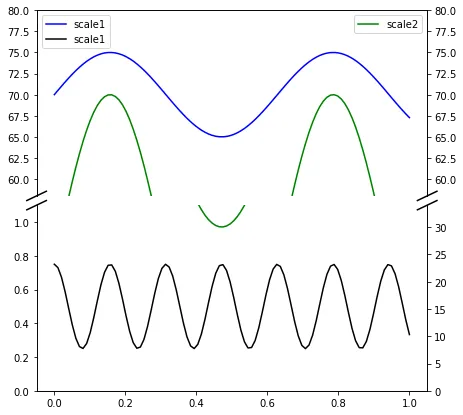
ax2.plot(x, 20 * np.sin(10 * x) + 50, color="green")

plt.show()

这里输入图片描述

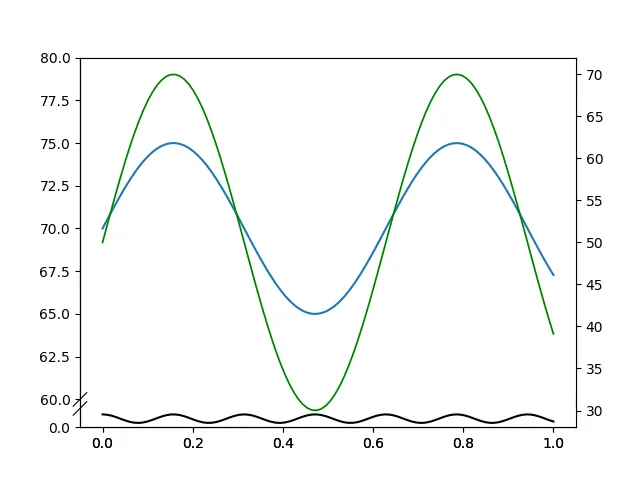
(在此示例中,我使用了ax.twinx,因为我无法将其与brokenaxes包配合使用。此外,正弦曲线和余弦曲线仅是示例,在实际图表中,它们被交换了。)


你尝试过这里的一些建议吗:https://github.com/bendichter/brokenaxes/issues/42 - trsvchn
@trsvchn 我看到了它,也稍微玩了一下,但不幸的是我无法完全理解它。 - Emma
1个回答

3

我不确定,但我认为最好的解决方案将是使用本地subplots并进行一些微调。以下是一个示例,基于Broken Axis。以下示例假定y轴具有不同的断点区域:

# Based on https://matplotlib.org/gallery/subplots_axes_and_figures/broken_axis.html

import numpy as np
import matplotlib.pyplot as plt


# generate data
x = np.linspace(0, 1, 100)
yleft1 = 5 * np.sin(10 * x) + 70
yleft2 = 0.25 * np.cos(40 * x) + 0.5
yright = 20 * np.sin(10 * x) + 50

# Start with subplots
fig, (ax1, ax2) = plt.subplots(2, 1, sharex=True, figsize=(7, 7))
fig.subplots_adjust(hspace=0.05)

# ax1 - is the top subplot
# ax2 - is the bottom subplot

# prepare twinned axes
ax3 = ax1.twinx()
ax4 = ax2.twinx()

# set limits for left y-axis
ax1.set_ylim(58, 80)
ax2.set_ylim(0, 1.1)

# set limits for right y-axis (twinned)
ax3.set_ylim(58, 80)
ax4.set_ylim(0, 34)

# turn off spines
ax1.spines['bottom'].set_visible(False)
ax2.spines['top'].set_visible(False)
ax3.spines['bottom'].set_visible(False)
ax4.spines['top'].set_visible(False)

# setup ticks
ax1.tick_params(bottom=False)
ax2.tick_params(bottom=True)

# plotting break diagonals
d = 0.025  # line length 
ax1.plot((-d, +d), (-d, +d), c='k', clip_on=False, transform=ax1.transAxes)
ax1.plot((1 - d, 1 + d), (-d, +d), c='k', clip_on=False, transform=ax1.transAxes)
ax2.plot((-d, +d), (1 - d, (1 + d)), c='k', clip_on=False, transform=ax2.transAxes)
ax2.plot((1 - d, 1 + d), (1 - d, 1 + d), c='k', clip_on=False, transform=ax2.transAxes)


ax1.plot(x, yleft1, c='b', label='scale1')
ax2.plot(x, yleft1, c='b', label='scale1')

ax1.plot(x, yleft2, c='k', label='scale1')
ax2.plot(x, yleft2, c='k', label='scale1')

ax3.plot(x, yright, c='g', label='scale2')
ax4.plot(x, yright, c='g', label='scale2')

ax1.legend(loc=2)
ax3.legend(loc=1)

plt.show()

enter image description here


如何为图中的两个y轴添加一个共同的ylabel? - Zee
@Zee 我认为最简单的方法是使用 text 方法 fig.text(0.0, 0.5, "common ylabel", va="center", rotation="vertical")(不需要创建另一个图形)。 - trsvchn
1
你说得对,但我的图有子图(nrows = 3,ncols = 2),每个子图都有两个断开的y轴脊椎。我想为每个子图设置一个共同的标签(3个行的3个ylabel)。而不是整个图的y轴。 - Zee
1
@Zee 这个 https://dev59.com/tGQo5IYBdhLWcg3wUd-L#23638795 回答了你的问题吗? - trsvchn
1
是的。 它有效了。 必须稍微调整一下。 但是这个答案有帮助。 谢谢 - Zee

网页内容由stack overflow 提供, 点击上面的
可以查看英文原文,
原文链接